
import pandas as pd
import matplotlib.pyplot as plt
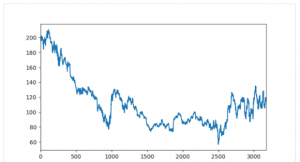
def test_run():
df = pd.read_csv("data/APPL.csv")
print df['Adj Close']
df['Adj Close'].plot()
plot.show()
if __name__ == "__main__":
test_run()
Here we go
import pandas as pd
import matplotlib.pyplot as plt

def test_run():
	df = pd.read_csv("data/IBM.csv")
	df['High'].plot()
	plot.show()

if __name__ == "__main__":
	test_run()
plot two column, you can observe two lines
import pandas as pd
import matplotlib.pyplot as plt

def test_run():
	df = pd.read_csv("data/APPL.csv")
	df[['Close','Adj Close']].plot()
	plot.show()

if __name__ == "__main__":
	test_run()