RGL

RGL is a package in which functions for performing three-dimensional plotting are condensed. Three-dimensional plots can be created, and the plotted figures can be moved with the mouse, and enlargement / reduction can be performed.

Here is an example of the instructions from installing the package to displaying example. After plotting, you can rotate the figure by moving the mouse while holding the figure with the left click, or zoom in and out of the figure by turning the mouse wheel.

install.packages("rgl")
library(rgl)
open3d()
example(rgl.surface)
for(i in 1:360) rgl.viewpoint(i, 1/4)

ggplot2

> library(ggplot2)
> names(faithful)
[1] "eruptions" "waiting" 
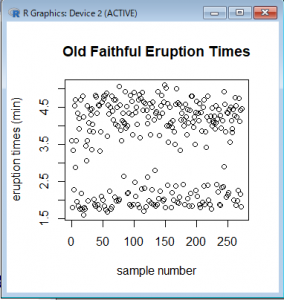
> plot(faithful$eruptions, xlab = "sample number", ylab = "eruption times (min)", main = "Old Faithful Eruption Times")

qplot(x = waiting,
	data = faithful,
	binwindth = 3,
	main = "Waiting time to next eruption(min)")
ggplot(faithful, aes(x = waiting)) +
	geom_histogram(bindwidth = 1)

> names(mtcars)
[1] “mpg” “cyl” “disp” “hp” “drat” “wt” “qsec” “vs” “am” “gear”
[11] “carb”

Basic syntax

a = 3.2
a = "a string"
print("The variable 'a' stores:"); print(a)

a = 10; b = 5; c = 1
if (a < b){
  d = 1
}else if (a == b){
  d = 2
}else{
  d = 3
}
d
stopifnot(d==3)

sum = 0
i = 1
while(i <= 10){
  sum = sum + i
  i = i + 1
}
stopifnot(sum==55)

mySum = function(a,b){
  return(a + b)
}
x = vector(length=3, mode="numeric")

y = c(4,3,3)

stopifnot( x == c(0,0,0))

stopifnot(length(y) == 3)

x[1] = 2
x[3] = 1
stopifnot( x == c(2,0,1) )

a = 2*x + y
stopifnot( a == c(8,3,4) )

a = a - 1
stopifnot( a == c(7,2,3) )

stopifnot( (a>=7) == c(TRUE,FALSE,FALSE))
stopifnot( (a==2) == c(FALSE,TRUE,FALSE))

mask = c(TRUE,FALSE,TRUE)
stopifnot( a[mask] == c(7,3) )

indices = c(1,3)
stopifnot( a[indices] == c(7,3))

stopifnot( a[c(-1,-3)] == c(2) )

stopifnot( any(c(FALSE,TRUE,FALSE)) )
stopifnot( all(c(TRUE,TRUE,TRUE)) )
stopifnot( which(c(TRUE,FALSE,TRUE)) == c(1,3) )

b = rep(3.2, times=5)
stopifnot( b == c(3.2, 3.2, 3.2, 3.2, 3.2))

w = seq(0,3)
stopifnot(w == c(0,1,2,3))

x = seq(0,1,by=0.2)
stopifnot(x == c(0.0, 0.2, 0.4, 0.6, 0.8, 1.0))

y = seq(0,1,length.out=3)
stopifnot( x == c(0.0, 0.5, 1.0) )

z = 1:10
stopifnot(z == seq(1,10,by=1))

sum = 0
for(i in z){
	sum = sum + i
}
stopifnot(sum == 55)

x = 1:10
f = function(a){
	a[1] = 10
}
f(x)
stopifnot(x == 1:10)

Manipulating Array

[,1][.2]
y `= [,1] 1 5
[,2] 2 6

2 * y + 1
y `= [,1] 3 11
[,2] 5 13

y %*% Y
y `= [,1] 11 35
[,2] 14 46

outer(x[,1], x[,1])
[,1] [,2] [,3] [,4] [,5]
[1,] 1 5 9 13 17
[2,] 2 6 10 14 18
[3,] 3 7 11 15 19
[4,] 4 8 12 16 20

rbind(x[1,], x[1,])
rbindは縦に結合
[,1] [,2] [,3] [,4] [,5]
[1,] 1 5 9 13 17
[2,] 1 5 9 13 17

cbind(x[1,], x[1,])

L = list(name = ‘John’, age=55, no.children=2, children.ages = c(15, 18))
names(L) name age no.children children.ages
L[[2]] 55
L$name John
L[‘name’] John
L$children.ages[2]
L[[4]][2]

names(R) = c(“NAME”, “AGE”, “SALARY”)

if-Else

a = 10; b = 5; c = 1
if (a < b){
	d = 1
} else if (a == b){
	d = 2
} else {
	d = 3
}
print(d)

R for loop

total = function(n){
    sum = 0
    for(i in 1:100){
    sum = sum + i
    }
    
    print(sum)
    return(sum)
}
total(100)
total = function(n){
    sum = 5050
    num = n
    repeat {
      sum = sum - num
      num = num - 1
      if(sum == 0)break
    }
    return(sum)
}
total = function(){
    sum = 0
    a = 1
    b = 10
    
    while (a
	

R command

ls() – list variable names in workspace memory
save.image(file=”R_workspace”) – saving variables to a file
save(new.var, legal.var.name, file = “R_workspace”) – save specified variables
load(“R_workspace”) – load variables saved in a file
system(“ls -al”) – executes a command in the shell, for example ls -al

scalar
numeric, integer, logical

ordered factor

current.season = factor("summer", levels = c("summer", "fall", "winter", "spring"), ordered = TRUE)

x = c(4,3,3,4,3,1)
outcome: 433431
length(x)
outcome: length = 6
y = vector(mode=”logical”, length=4)
outocome: y= FALSE FALSE FALSE FALSE
z = vector(length=3, mode==”numeric”)
outcome: z = 0 0 0

q = rep(3.2, times = 10)
q = 3.2 3.2 3.2 3.2 3.2 3.2 3.2 3.2 3.2 3.2
w = seq(0, 1 by=0.1)
w – 0.0 0.1 0.2 … 0.9 1.0
w = seq(0, 1, length.out 11)

w <= 0.5 0.0 0.1 0.2 0.3 0.4 0.5 any(w <= 0.5) TRUE all(w <= 0.5) FALSE which(w <= 0.5) 1 2 3 4 5 6

List of DataSet

> data(iris)
> head(iris)
  Sepal.Length Sepal.Width Petal.Length Petal.Width Species
1          5.1         3.5          1.4         0.2  setosa
2          4.9         3.0          1.4         0.2  setosa
3          4.7         3.2          1.3         0.2  setosa
4          4.6         3.1          1.5         0.2  setosa
5          5.0         3.6          1.4         0.2  setosa
6          5.4         3.9          1.7         0.4  setosa
> levels(iris$Species)
[1] "setosa"     "versicolor" "virginica" 
> install.packages("ggplot2")

R: statistics, bio-statistics, social sciences
Matlab: engineering, applied math
python: web development, scripting

Running R – interactively

source("foo.R")
R CMD BATCH foo.R
Rscript foo.R

R Help documentation
>help {utils}
R Documentation
Documentation
Description
help is the primary interface to the help systems.
Usage
help(topic, package = NULL, lib.loc = NULL,
verbose = getOption(“verbose”),
try.all.packages = getOption(“help.try.all.packages”),
help_type = getOption(“help_type”))….

Alpha and Jitter

'''(r)
ggplot(aes(x = age, y = friends_initiated), data = pf)
 geom_point(alpha = 1/10, position = 'jitter')
'''
age_groups <- group_by(pf, age)
pf.fc_by_age <- summarise(age_groups,
	friend_count_mean = mean(friend_count),
	friend_count_median = median(friend_count),
	n = n())
pf.fc_by_age <- arrange(pf.fc_by_age, age)
head(pf.fc_by_age)

Explore Variables

Scatterplots

'''(r)
library(ggplot2)
pf <- read.csv('pseudo_facebook.tsv', sep = '\t')

qplot(x = age, y = friend_count, data = pf)
qplot(age, friend_count, data = pf)
'''
'''(r)
qplot(x = age, y = friend_count, data = pf)

ggplot(aes(x = age, y= friend_count), data = pf) + geom_point()

summary(pf$age)
'''
'''(r)
ggplot(aes(x = age, y = friend_count),data = pf)+
	geom_point(alpha = 1/20) + xlim(13, 90)
'''

Histogram of Users’ birth

'''(r)
install.packages('ggplot2')

names(pf)
qplot(x -dob_day, data - pf)
'''
'''(r)
qplot(x - friend_count, data - pf)
'''
'''(r)
qplot(x - friend_count, data - pf, xlim - c(0, 1000))

qplot(x - friend_count, data_pf) +
	scale_x_continuous(limits - c(0, 1000))
'''

R Markdown Documents

'''{r}
# the hash or pound symbol inside the block creates
# a comment. These three lines of are not code and cannot be
x <- [1:10]
mean(x)
'''
a <- c(1,2,5.3,6,-2,4) # numeric vector
b <- c("one","two","three") # character vector
c <- c(TRUE,TRUE,TRUE,FALSE,TRUE,FALSE) #logical vector
reddit <- read.csv('reddit.csv')

table(reddit$employment)

str(reddit)
levels(reddit$age.range)

library(ggplot2)
qplot(data = reddit, x = age.range)