
[vagrant@localhost python]$ python
Python 3.6.4 (default, Sep 5 2019, 00:12:03)
[GCC 4.4.7 20120313 (Red Hat 4.4.7-23)] on linux
Type “help”, “copyright”, “credits” or “license” for more information.
>>> import matplotlib
>>> matplotlib.matplotlib_fname()
‘/home/vagrant/.config/matplotlib/matplotlibrc’
>>>
[vagrant@localhost python]$ sudo vi /home/vagrant/.config/matplotlib/matplotlibrc
backendの記載をtkaggに変えます
backend : tkagg
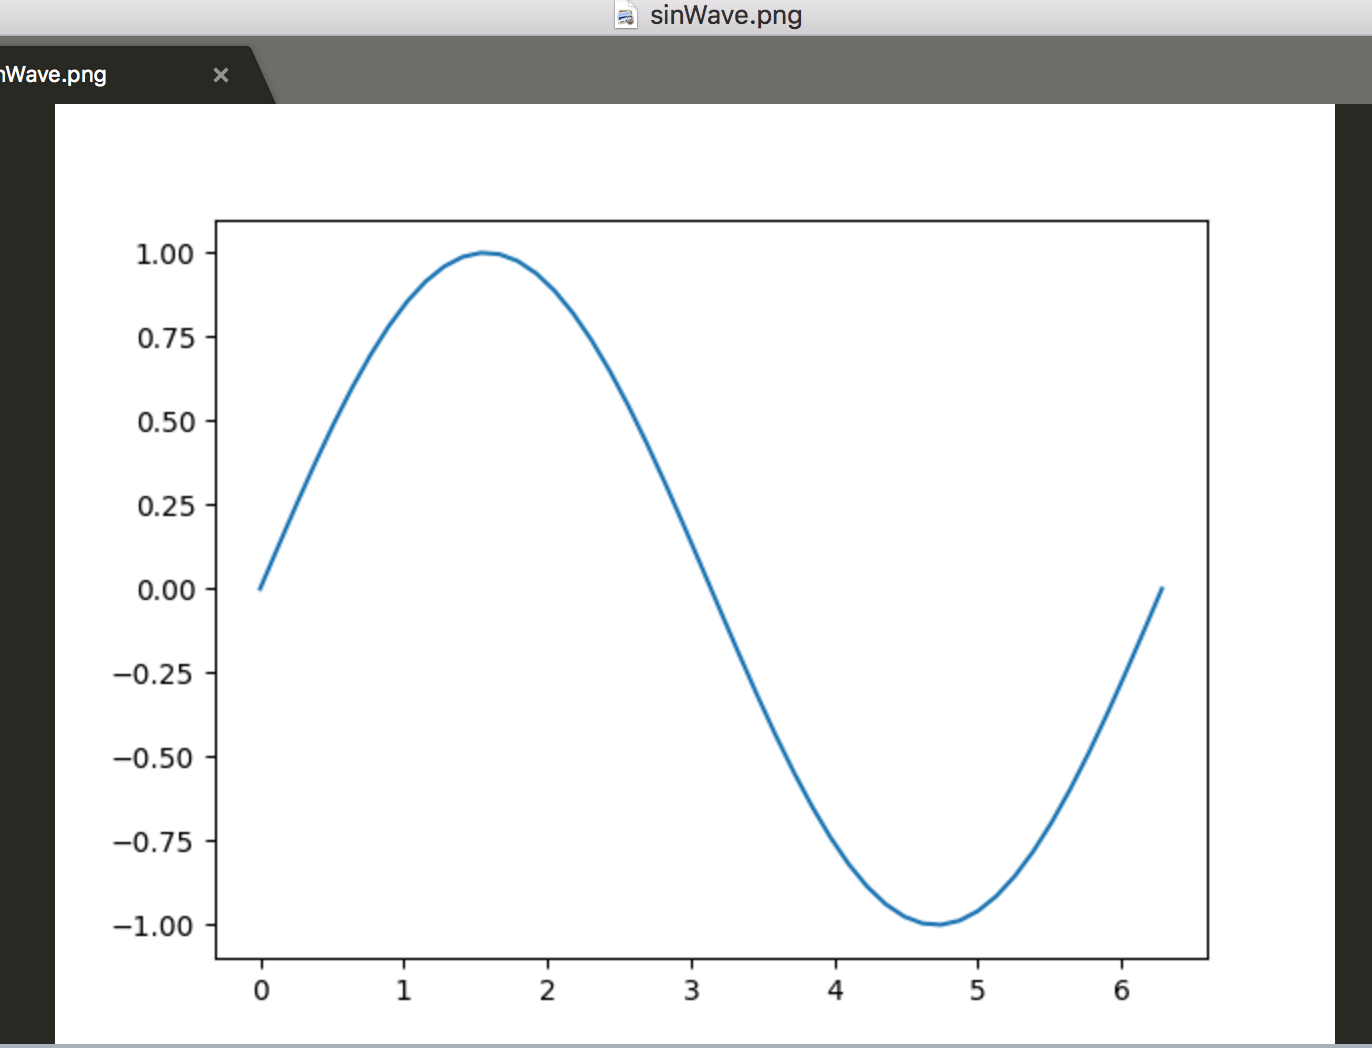
import math
import numpy as np
from matplotlib import pyplot

pi = math.pi   #mathモジュールのπを利用

x = np.linspace(0, 2*pi)
y = np.sin(x)

pyplot.plot(x, y)
pyplot.savefig( 'sinWave.png' )
ほう