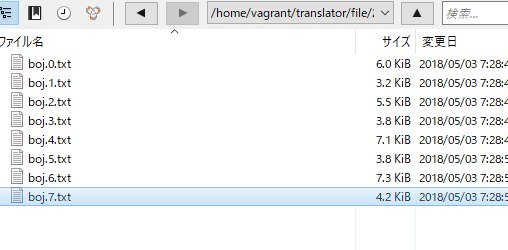
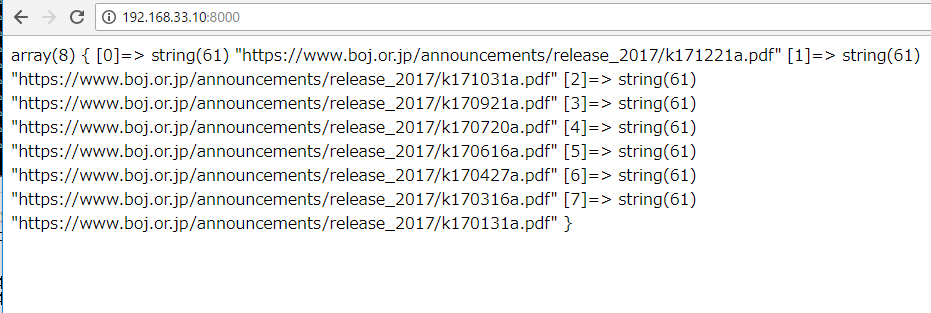
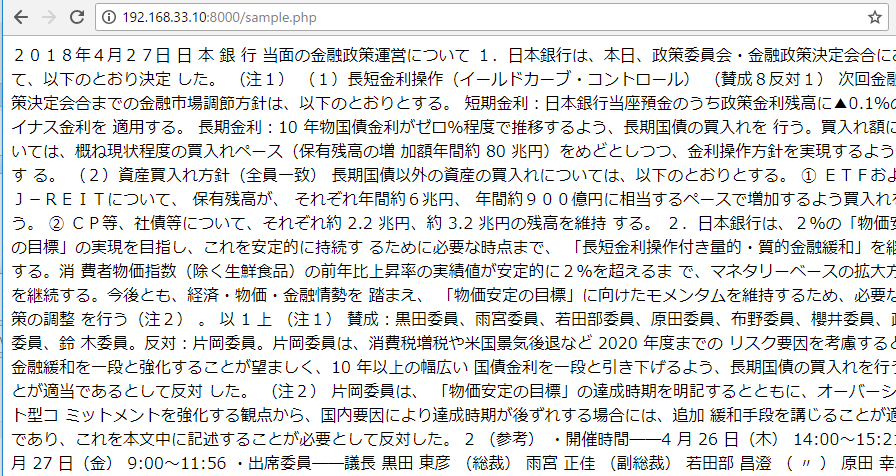
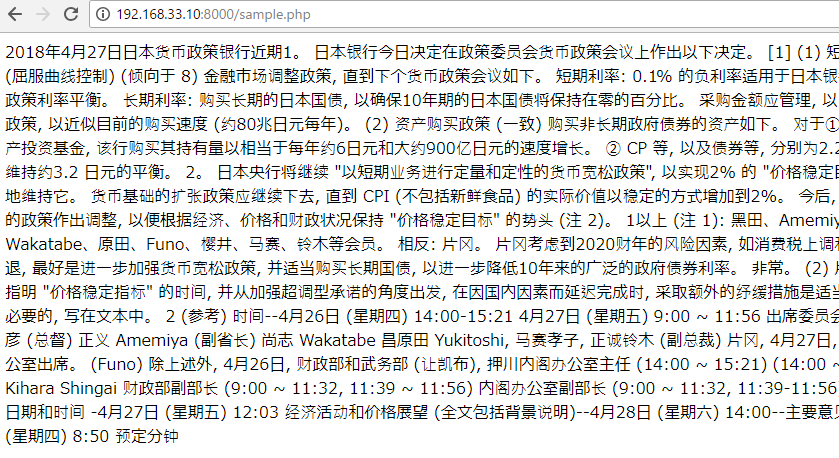
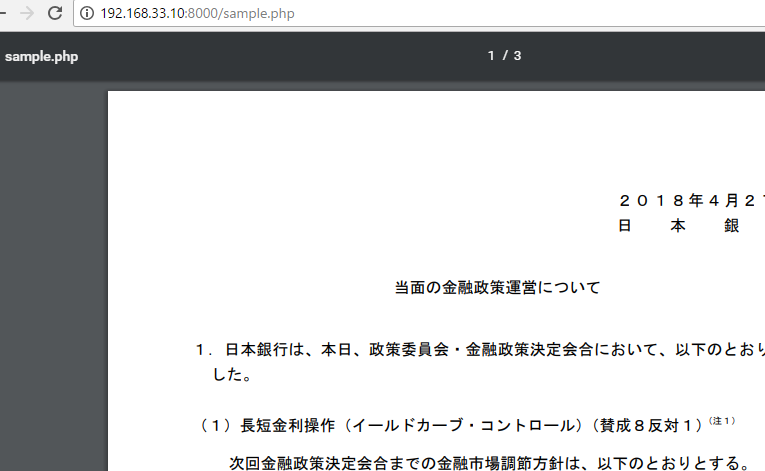
日銀pdf->txtに変換したファイルを中国語に翻訳

まず、xpdfでつくったテキストファイルを1行ずつ読み込みます。

$file = fopen("boj.txt", "r");

if($file){
	while ($line = fgets($file)){
		echo $line;
	}
}

fclose($file);

good job!

while文で$txt .= $line; として、変数に入れていき、
これをazureで中国語に翻訳します。

<?php

$file = fopen("boj.txt", "r");

if($file){
	while ($line = fgets($file)){
		$text .= $line;
	}
}

fclose($file);

$key = 'hogehoge';

$host = "https://api.cognitive.microsofttranslator.com";
$path = "/translate?api-version=3.0";
$params = "&to=zh";

if(!function_exists('com_create_guid')){
	function com_create_guid(){
		return sprintf('%04x%04x-%04x-%04x-%04x-%04x%04x%04x',
		mt_rand(0, 0xffff), mt_rand(0, 0xffff),
		mt_rand(0, 0xffff),
		mt_rand(0, 0x0fff) | 0x4000,
		mt_rand(0, 0x3fff) | 0x8000,
		mt_rand(0, 0xffff), mt_rand(0, 0xffff), mt_rand(0, 0xffff));
	}
}

function Translate ($host, $path, $key, $params, $content) {
    $headers = "Content-type: application/json\r\n" .
        "Content-length: " . strlen($content) . "\r\n" .
        "Ocp-Apim-Subscription-Key: $key\r\n" .
        "X-ClientTraceId: " . com_create_guid() . "\r\n";
    $options = array (
        'http' => array (
            'header' => $headers,
            'method' => 'POST',
            'content' => $content
        )
    );
    $context  = stream_context_create($options);
    $result = file_get_contents ($host . $path . $params, false, $context);
    return $result;
}

$requestBody = array (
    array (
        'Text' => $text,
    ),
);
$content = json_encode($requestBody);
$result = Translate($host, $path, $key, $params, $content);

$json = json_decode($result);
$newtext =  $json[0]->translations[0]->text;
?>
<div id="text1">
    <?php echo $newtext; ?>
</div>

あれ、これなんかヤベーことになってないか?大丈夫か?

2018年4月27日日本货币政策银行近期1。 日本银行今日决定在政策委员会货币政策会议上作出以下决定。 [1] (1) 短和长率操作 (屈服曲线控制) (倾向于 8) 金融市场调整政策, 直到下个货币政策会议如下。 短期利率: 0.1% 的负利率适用于日本银行支票账户的政策利率平衡。 长期利率: 购买长期的日本国债, 以确保10年期的日本国债将保持在零的百分比。 采购金额应管理, 以实现利率经营政策, 以近似目前的购买速度 (约80兆日元每年)。 (2) 资产购买政策 (一致) 购买非长期政府债券的资产如下。 对于① etf 和 J-房地产投资基金, 该行购买其持有量以相当于每年约6日元和大约900亿日元的速度增长。 ② CP 等, 以及债券等, 分别为2.2 日元左右, 以维持约3.2 日元的平衡。 2。 日本央行将继续 “以短期业务进行定量和定性的货币宽松政策”, 以实现2% 的 “价格稳定目标”, 并稳定地维持它。 货币基础的扩张政策应继续下去, 直到 CPI (不包括新鲜食品) 的实际价值以稳定的方式增加到2%。 今后, 我们将对必要的政策作出调整, 以便根据经济、价格和财政状况保持 “价格稳定目标” 的势头 (注 2)。 1以上 (注 1): 黑田、Amemiya、尚志 Wakatabe、原田、Funo、樱井、马赛、铃木等会员。 相反: 片冈。 片冈考虑到2020财年的风险因素, 如消费税上调和美国经济衰退, 最好是进一步加强货币宽松政策, 并适当购买长期国债, 以进一步降低10年来的广泛的政府债券利率。 非常。 (2) 片冈委员会须指明 “价格稳定指标” 的时间, 并从加强超调型承诺的角度出发, 在因国内因素而延迟完成时, 采取额外的纾缓措施是适当的。 这是不必要的, 写在文本中。 2 (参考) 时间–4月26日 (星期四) 14:00-15:21 4月27日 (星期五) 9:00 ~ 11:56 出席委员会-主席黑田东彦 (总督) 正义 Amemiya (副省长) 尚志 Wakatabe 昌原田 Yukitoshi, 马赛孝子, 正诚铃木 (副总裁) 片冈, 4月27日, 财政部内阁办公室出席。 (Funo) 除上述外, 4月26日, 财政部和武务部 (让凯布), 押川内阁办公室主任 (14:00 ~ 15:21) (14:00 ~ 15:22), Kihara Shingai 财政部副部长 (9:00 ~ 11:32, 11:39 ~ 11:56) 内阁办公室副部长 (9:00 ~ 11:32, 11:39-11:56), 货币政策的日期和时间 -4月27日 (星期五) 12:03 经济活动和价格展望 (全文包括背景说明)–4月28日 (星期六) 14:00–主要意见–5月10日 (星期四) 8:50 预定分钟

trafficの分類

document.referrerで取得したURLにRegular Expressionで該当すればフラグを立てたい。

1.Organic Search
https://www.google.co.jp
https://www.bing.com/
https://www.yahoo.co.jp/
https://www.msn.com/ja-jp/
http://www.baidu.com/

2.Social
https://www.facebook.com/
https://twitter.com/?lang=ja
https://www.instagram.com/?hl=ja
https://line.me/ja/

3.Direct

4.Referral

早速書いてみる。

$url = "ttps://www.google.co.jp/search?q=%E6%A9%9F%E6%A2%B0%E5%AD%A6%E7%BF%92&oq=%E6%A9%9F%E6%A2%B0%E5%AD%A6%E7%BF%92&aqs=chrome..69i57j69i61l3j0l2.3764j0j7&sourceid=chrome&ie=UTF-8";
if(preg_match("/www.google/", $url)){
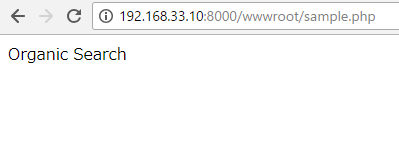
  $channel = "Organic Search"; 
  $media = "google";
} else{
  $channel = "else";
}
echo $channel;

項目を増やします。yahooはco.jpもcomも検索時に、https://search.yahoo.comとサブドメインにsearchが付きます。(分かり易い!)

$url = "http://hpscript.com/ip/";
if(empty($url)){
  $channel = "Direct"; 
}elseif(preg_match("/www.google/", $url)){
  $channel = "Organic Search"; 
  $media = "google";
}elseif(preg_match("/www.bing/", $url)){
  $channel = "Organic Search"; 
  $media = "bing";
}elseif(preg_match("/search.yahoo/", $url)){
  $channel = "Organic Search"; 
  $media = "yahoo";
}elseif(preg_match("/www.baidu/", $url)){
  $channel = "Organic Search"; 
  $media = "baidu";
}elseif(preg_match("/www.facebook/", $url)){
  $channel = "Social"; 
  $media = "facebook";
}elseif(preg_match("/twitter/", $url)){
  $channel = "Social"; 
  $media = "twitter";
}elseif(preg_match("/www.instagram/", $url)){
  $channel = "Social"; 
  $media = "twitter";
}elseif(preg_match("/line/", $url)){
  $channel = "Social"; 
  $media = "line";
}else{
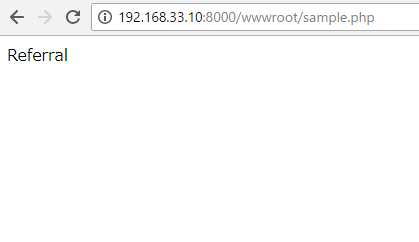
  $channel = "Referral";
}
echo $channel;

doubleclick.php(js受け取り)のphpで処理を書いていきます。

if(!is_null($data["acquisition"])){
	$url = $data["acquisition"];
	if(empty($url)){
	  $channel = "Direct"; 
	  $media = "(not set)";
	}elseif(preg_match("/www.google/", $url)){
	  $channel = "Organic Search"; 
	  $media = "google";
	}elseif(preg_match("/www.bing/", $url)){
	  $channel = "Organic Search"; 
	  $media = "bing";
	}elseif(preg_match("/search.yahoo/", $url)){
	  $channel = "Organic Search"; 
	  $media = "yahoo";
	}elseif(preg_match("/www.baidu/", $url)){
	  $channel = "Organic Search"; 
	  $media = "baidu";
	}elseif(preg_match("/www.facebook/", $url)){
	  $channel = "Social"; 
	  $media = "facebook";
	}elseif(preg_match("/twitter/", $url)){
	  $channel = "Social"; 
	  $media = "twitter";
	}elseif(preg_match("/www.instagram/", $url)){
	  $channel = "Social"; 
	  $media = "twitter";
	}elseif(preg_match("/line/", $url)){
	  $channel = "Social"; 
	  $media = "line";
	}else{
	  $channel = "Referral";
	  $media = $url;
	}
	$data = $data + array('channel'=>$channel, 'media'=>$media);
}

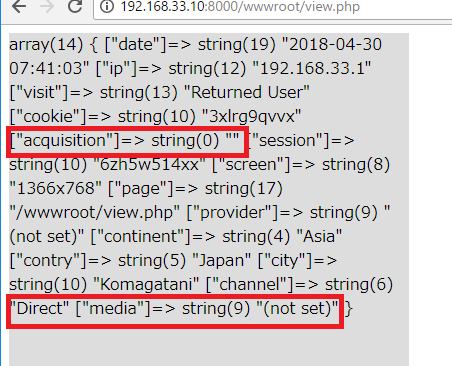
directの場合は、mediaは(not set)

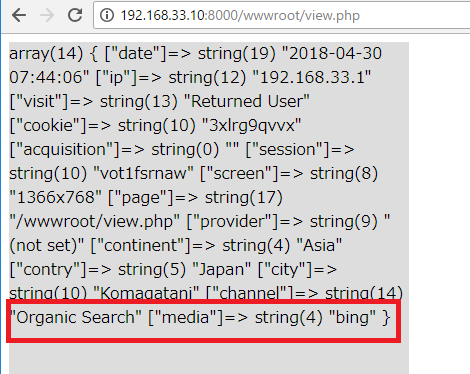
urlがbingにマッチしたら、channelはorganic searchになります。

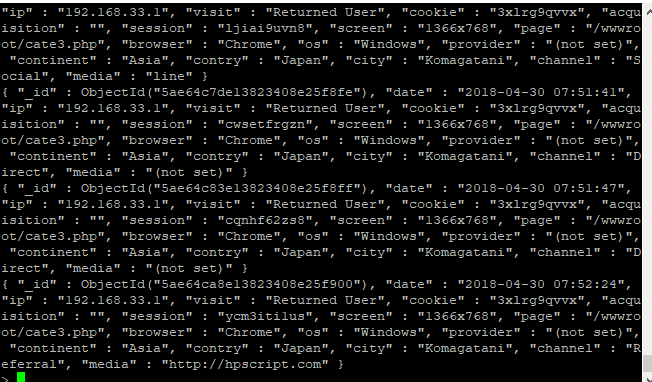
mongoDBにも入っています。

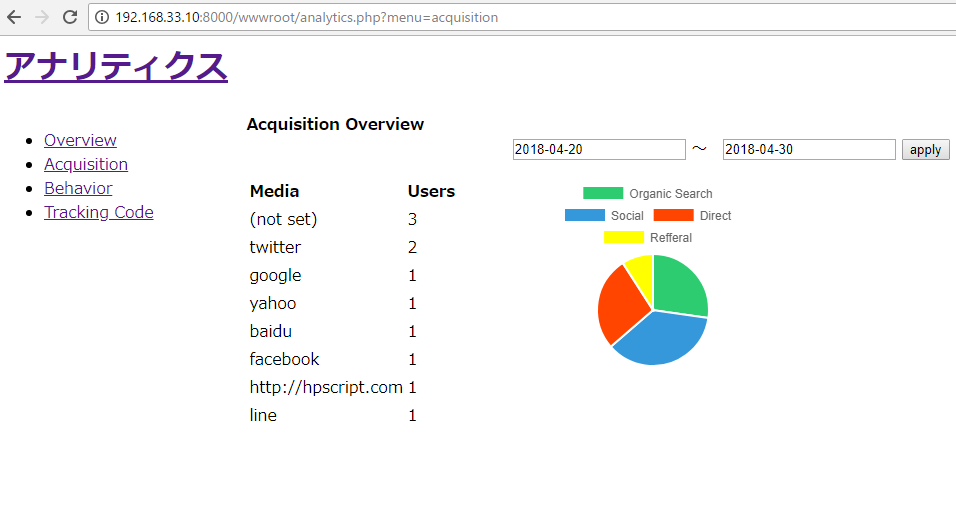
つづいて、データを入れてanalytics側のviewをつくっていきます。
organic, social, direct, refferalの分類はchart.jsを使いたい。

OK!!!!!!!!!!!!!!!!!!!!!!!
リファクタリングして、次はスタイリングです!
今回はweb fontを使って、fontにもこだわりたい。

tracking code取得画面を作成する

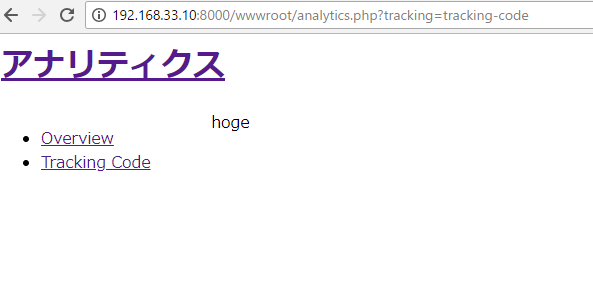
初期画面

<?php if($_GET&#91;"tracking"&#93; == 'tracking-code'): ?>
  hoge
<?php else: ?>
<?php endif; ?>

クリックするとコピーする機能を付けたい。
onclick=”this.select(0,this.value.length)”と書くと、クリックで全選択できる。

<?php if($_GET&#91;"tracking"&#93; == 'tracking-code'): ?>
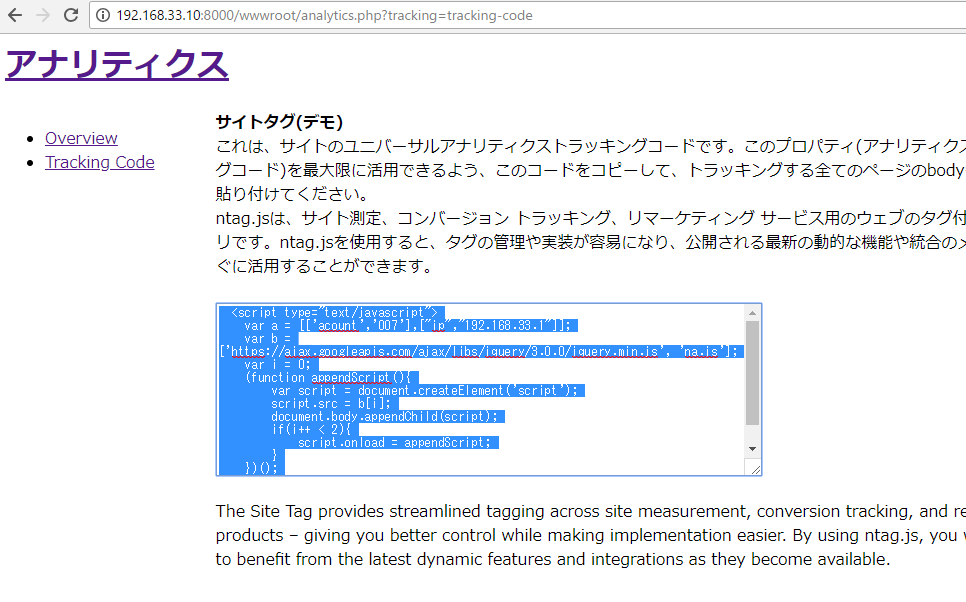
  <b>サイトタグ(デモ)</b><br>
  これは、サイトのユニバーサルアナリティクストラッキングコードです。このプロパティ(アナリティクストラッキングコード)を最大限に活用できるよう、このコードをコピーして、トラッキングする全てのページのbodyタグの前に貼り付けてください。<br>
  ntag.jsは、サイト測定、コンバージョン トラッキング、リマーケティング サービス用のウェブのタグ付けライブラリです。ntag.jsを使用すると、タグの管理や実装が容易になり、公開される最新の動的な機能や統合のメリットをすぐに活用することができます。<br><br>
  <textarea name="tracking-code" rows="13" cols="75" onclick="this.select(0,this.value.length)">
  <script type="text/javascript">
    var a = [['acount','007'],["ip","<?php echo $_SERVER&#91;'REMOTE_ADDR'&#93;; ?>"]];
    var b =['https://ajax.googleapis.com/ajax/libs/jquery/3.0.0/jquery.min.js', 'na.js'];
    var i = 0;
    (function appendScript(){
        var script = document.createElement('script');
        script.src = b[i];
        document.body.appendChild(script);
        if(i++ < 2){
            script.onload = appendScript;
        }
    })();
</script>
</textarea><br><br>
The Site Tag provides streamlined tagging across site measurement, conversion tracking, and remarketing products – giving you better control while making implementation easier. By using ntag.js, you will be able to benefit from the latest dynamic features and integrations as they become available.

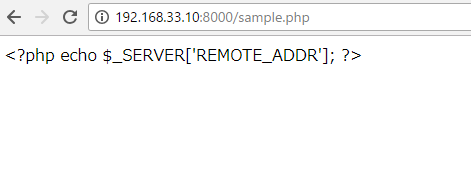
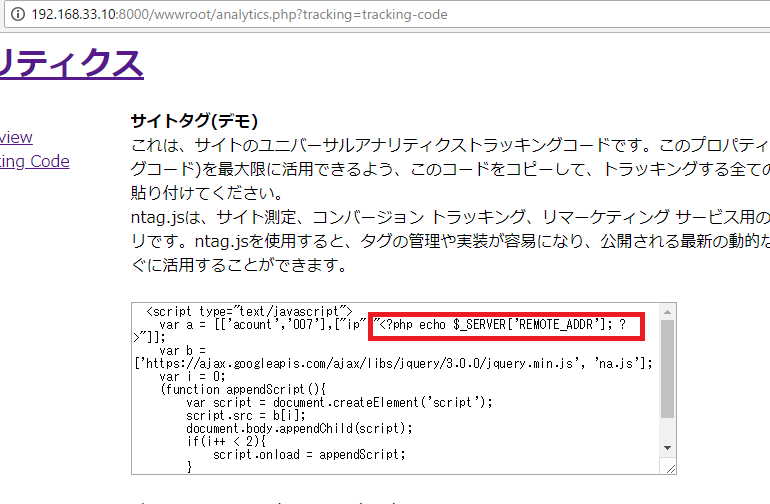
よく見たら、echo $_SERVER[‘REMOTE_ADDR’];が上手くいってない。

htmlspecialcharでエスケープします。

<?php 
$hoge = '<?php echo $_SERVER&#91;\'REMOTE_ADDR\'&#93;; ?>';
?>
<?php echo htmlspecialchars($hoge);?>

修正しました。

問題はこっからどうするかだな。。
GAでよく見るのはページごとのavg timeと、リファラーがOrganic・social・directか、あたりの指標なので、そこをチャレンジしたい。

GETパラメーターをhiddenで送る

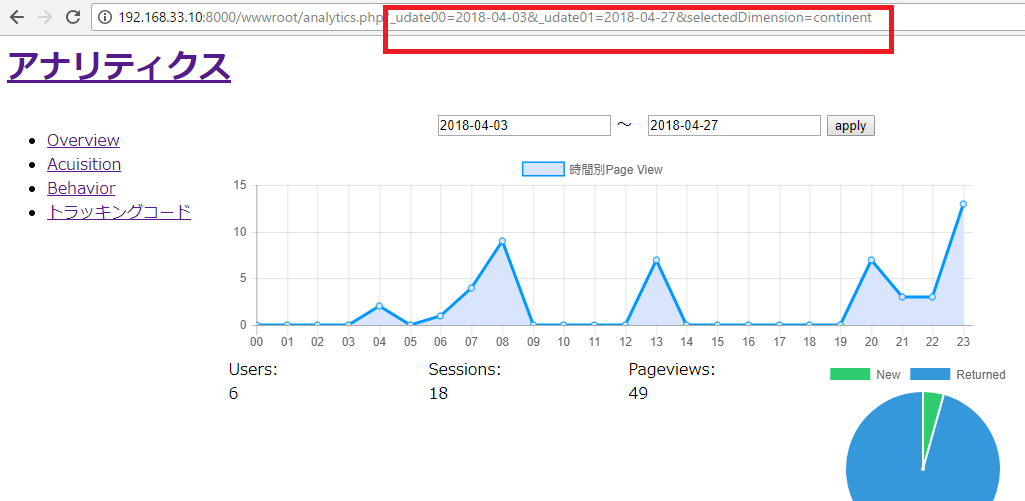
日付のパラメーターがついていた場合には、それに地域パラメータを加えてリンクさせる。

if(isset($_GET['_udate00'])&&isset($_GET['_udate01'])) {
  $date1 = $_GET['_udate00'];
  $date2 = $_GET['_udate01'] . " 23:59:59";
  $continent = "?_udate00".$_GET['_udate00']."&_udate01=".$_GET['_udate01']."&selectedDimension=continent";
  $contry = "?_udate00".$_GET['_udate00']."&_udate01=".$_GET['_udate01']."&selectedDimension=contry";
  $city = "?_udate00".$_GET['_udate00']."&_udate01=".$_GET['_udate01']."&selectedDimension=city";
} else {
  $date1 = date("Y-m-d", strtotime("-10 day"));
  $date2 = date("Y-m-d H:i:s");
  $continent = "?selectedDimension=continent";
  $contry = "?selectedDimension=contry";
  $city = "?selectedDimension=city";
}
if(isset($_GET['selectedDimension'])){
  $c = $_GET['selectedDimension'];
}

datepickerのformでは、hiddenでipの地域データをsubmitさせます。

<form method="GET" name="form" action="">
<input name="_udate00" type="text" id="datepicker" value="<?php echo $date1; ?>"> ~ <input name="_udate01" type="text" id="datepicker2" value="<?php echo $date2; ?>">
<input type="hidden" name="selectedDimension" value="<?php echo $c; ?>">
<input type="submit" class="submit" value="apply">
</form>

両方ついています。

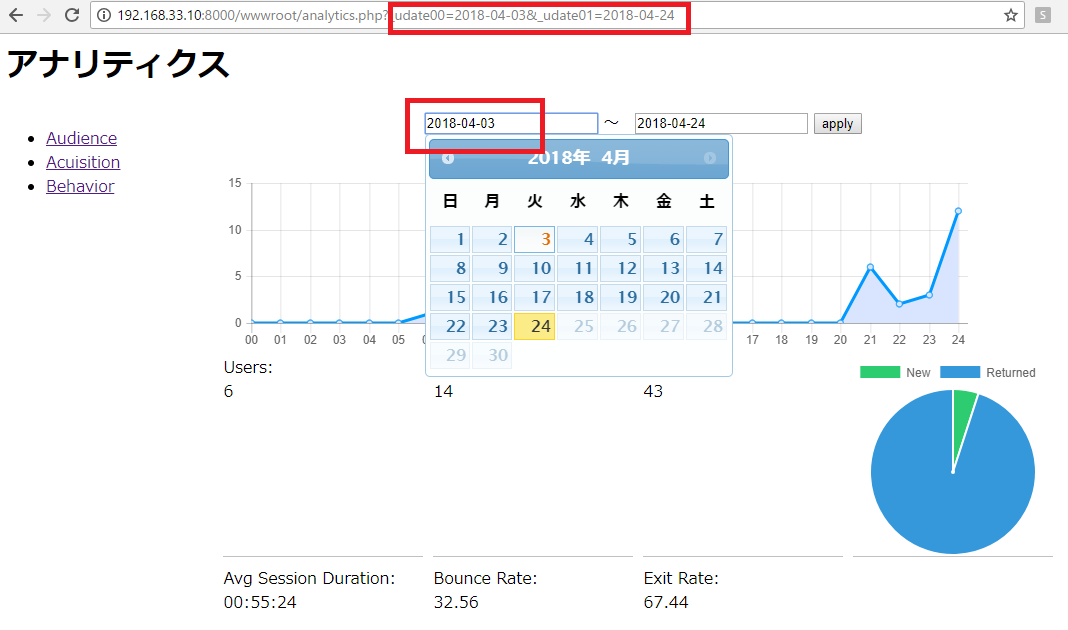
dateのfrom – toをgetパラメーターで送る

パラメーターのnameはGA同様、_u.date00、_u.date01にします。

<?php
$date1 = date("Y-m-d", strtotime("-50 days"));
$date2 = date("Y-m-d");

?>
<style>
input{
	width:90px;
}
</style>

<script src="https://ajax.googleapis.com/ajax/libs/jquery/1.9.1/jquery.min.js"></script>
<script src="http://ajax.googleapis.com/ajax/libs/jqueryui/1/jquery-ui.min.js"></script>
<script src="http://ajax.googleapis.com/ajax/libs/jqueryui/1/i18n/jquery.ui.datepicker-ja.min.js"></script>
<link rel="stylesheet" href="http://ajax.googleapis.com/ajax/libs/jqueryui/1/themes/redmond/jquery-ui.css" >

<form method="GET" name="form" action="">
<input name="_u.date00" type="text" id="datepicker" value="<?php echo $date1; ?>"> ~ <input name="_u.date01" type="text" id="datepicker2" value="<?php echo $date2; ?>">
<input type="submit" class="submit">
</form>
<script>
  var dateFormat = 'yy-mm-dd';
  $(function() {
    $("#datepicker").datepicker({
    	dateFormat: dateFormat,
    	maxDate:0,
    	onClose: function(dateText, inst){
    		$('#datepicker2').datepicker('option', 'minDate', dateText);
    		$('#datepicker').val(dateText);
    	}
    });
    $("#datepicker2").datepicker({
    	dateFormat: dateFormat,
    	maxDate:0,
    	onClose: function(dateText, inst){
    		$('#datepicker').datepicker('option', 'maxDate', dateText);
    		$('#datepicker2').val(dateText);
    	}
    });
  });
</script>

送れています。

つなげると、、、

mongodbのfilterで’date’ => [ ‘$gte’ => $date1, ‘$lte’ => $date2]とすると、
date2が00:00:00で算出してしまうので、以下のように、Getパラメーター取得時は、その日の23:59:59にします。

if(isset($_GET['_udate00'])&&isset($_GET['_udate01'])) {
  $date1 = $_GET['_udate00'];
  $date2 = $_GET['_udate01'] . " 23:59:59";
} else {
  $date1 = date("Y-m-d", strtotime("-10 day"));
  $date2 = date("Y-m-d H:i:s");
}

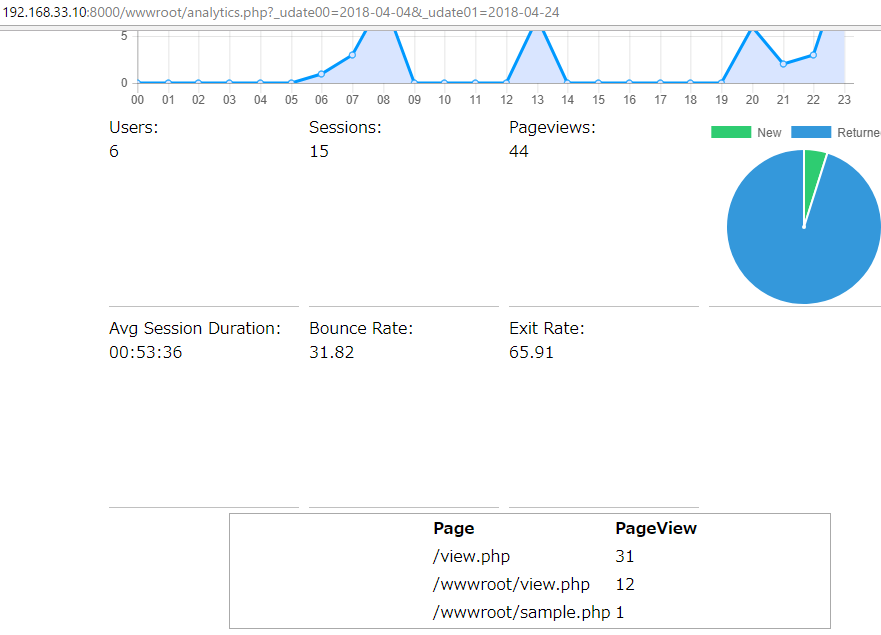
次はarray_count_valuesでアクセスされたページのテーブル表示です。

あれ、google見ると、ページごとにPageviews、Unique Pageviews、Avg. Time on Page 、Entrances、Bounce Rateがある。。。まじかよ。。。

時間別のPVをchart.jsで表示する

全て繋げます。

<?php

// $date1 = date("Y-m-d H:i:s", strtotime("- 6 day"));
$date1 = date("Y-m-d", strtotime("-10 day"));
// $date2 = date("Y-m-d H:i:s", strtotime("- 1 day"));
$date2 = date("Y-m-d H:i:s");


$mng = new MongoDB\Driver\Manager("mongodb://localhost:27017");
$filter =  &#91;
	'date' => [ '$gte' => $date1, '$lte' => $date2]
];
$options = [
  'projection' => ['_id' => 0],
  'sort' => ['_id' => -1],
];
$query = new MongoDB\Driver\Query($filter, $options);
$cursor = $mng->executeQuery('app.na007', $query);

foreach ($cursor as $document) {
  // var_dump($document);
  $pv[] = $document->date;
  $cookie[] = $document->cookie;
  $session[] = $document->session;
  if(!is_null($document->referrer)){
  $avgtime[] = $document->avgtime;
  }
  if(!is_null($document->referrer)){
  $referrer[] = $document->referrer;
  }
  $visit[] = $document->visit;
  $access[] = substr($document->date, 11, 2);
}
$visit = json_encode(array_count_values($visit));
$line = array("00"=>0,"01"=>0, "02"=>0,"03"=>0,"04"=>0,"05"=>0,"06"=>0,"07"=>0,"08"=>0,"09"=>0,"10"=>0,"11"=>0,"12"=>0,"13"=>0,"14"=>0,"15"=>0,"16"=>0,"17"=>0,"18"=>0,"19"=>0,"20"=>0,"21"=>0,"22"=>0,"23"=>0);
foreach($access as $value){switch($value){case '00':$line['00'] ++;break;case '01':$line['01'] ++;break;case '02':$line['02'] ++;break;case '03':$line['03'] ++;break;case '04':$line['04'] ++;break;case '05':$line['05'] ++;break;case '06':$line['06'] ++;break;case '07':$line['07'] ++;break;case '08':$line['08'] ++;break;case '08':$line['08'] ++;break;case '10':$line['10'] ++;break;case '11':$line['11'] ++;break;case '12':$line['12'] ++;break;case '13':$line['13'] ++;break;case '14':$line['14'] ++;break;case '15':$line['15'] ++;break;case '16':$line['16'] ++;break;case '17':$line['17'] ++;break;case '18':$line['18'] ++;break;case '19':$line['19'] ++;break;case '20':$line['20'] ++;break;case '21':$line['21'] ++;break;case '22':$line['22'] ++;break;case '23':$line['23'] ++;break;}}

$line_list = json_encode($line);
$uu = array_unique($cookie);
$session = array_unique($session);
$bounce = (count($pv) - count($referrer))/ count($pv) * 100;
$exit = (count($pv) - count($session))/ count($pv) * 100;
$avgtime = array_sum($avgtime) / count($avgtime);
$time = s2h($avgtime);
function s2h($avgtime){
  $hours = floor($avgtime / 3600);
  $minutes = floor(($avgtime / 60)%60);
  $seconds = $avgtime % 60;
  $hms = sprintf("%02d:%02d:%02d", $hours, $minutes, $seconds);
  return $hms; 
}
?>
<style>
.flex-container {
  display: flex;
}
.flex-1{
  flex:1;
}
.flex-2{
  flex:4;
}
#pie {
 height:190;
 width:190;
}
#line {
 height:200;
 width:750;
}
</style>
<script src="https://cdnjs.cloudflare.com/ajax/libs/Chart.js/2.1.4/Chart.min.js"></script>
<h1>アナリティクス</h1>
<div class="flex-container">
<div class="flex-1">
  <ul>
    <li><a href="">Audience</a></li>
    <li><a href="">Acuisition</a></li>
    <li><a href="">Behavior</a></li>
  </ul>
</div>
<div class="flex-2">
<?php echo $date1 ." ~ ".$date2 ."<br><br>"; ?>
<div id="line">
<canvas id="myLine" width="750" height="200"></canvas>
</div>
<div id="pie">
<canvas id="myChart" width="200" height="200"></canvas>
</div>
<?php
echo "<br>Users: ".count($uu)."<br>";
echo "Session: ".count($session)."<br>";
echo "Pageviews: ".count($pv)."<br>";
echo "avg time: " .$time."<br>";
echo "Bounce rate :" .sprintf('%.2f',$bounce)."%<br>";
echo "Exit rate:" .sprintf('%.2f',$exit)."%<br>";
?>
</div>
</div>

<script>
  var visit = JSON.parse('<?php echo $visit; ?>');
  console.log(visit);
  var ctx = document.getElementById("myChart").getContext('2d');
  var myChart = new Chart(ctx, {
  type: 'pie',
  data: {
    labels: ["New", "Returned"],
    datasets: [{
      backgroundColor: [
        "#2ecc71",
        "#3498db",
      ],
      data: [visit['New User'],visit['Returned User']]
    }]
  }
});
var line = JSON.parse('<?php echo $line_list; ?>');
console.log(line);
var ctx2 = document.getElementById("myLine").getContext('2d');
var myLine = new Chart(ctx2, {
   type: 'line',
   data: {
      labels: ["00", "01", "02", "03", "04", "05", "06", "07", "08", "09", "10", "11", "12","13","14","15","16","17","18","19","20","21","22","23","24"],
      datasets: [
      {
         label: "時間別Page View",
         borderColor: 'rgb(0, 153, 255)',
         backgroundColor: "#D9E5FF",
         lineTension: 0,
         data: [line['00'], line['01'],line['02'],line['03'],line['04'],line['05'],line['06'],line['06'],line['07'],line['08'],line['09'],line['10'],line['11'],line['12'],line['13'],line['14'],line['15'],line['16'],line['17'],line['18'],line['19'],line['20'],line['21'],line['22'],line['23']],
      },
      ]
   },
   options: {
      responsive: true,
      scales: {
        yAxes: [{
          ticks: {
            // max: Math.max.apply(null, line)*1.2,
          }
        }]
      }
   }
});
</script>

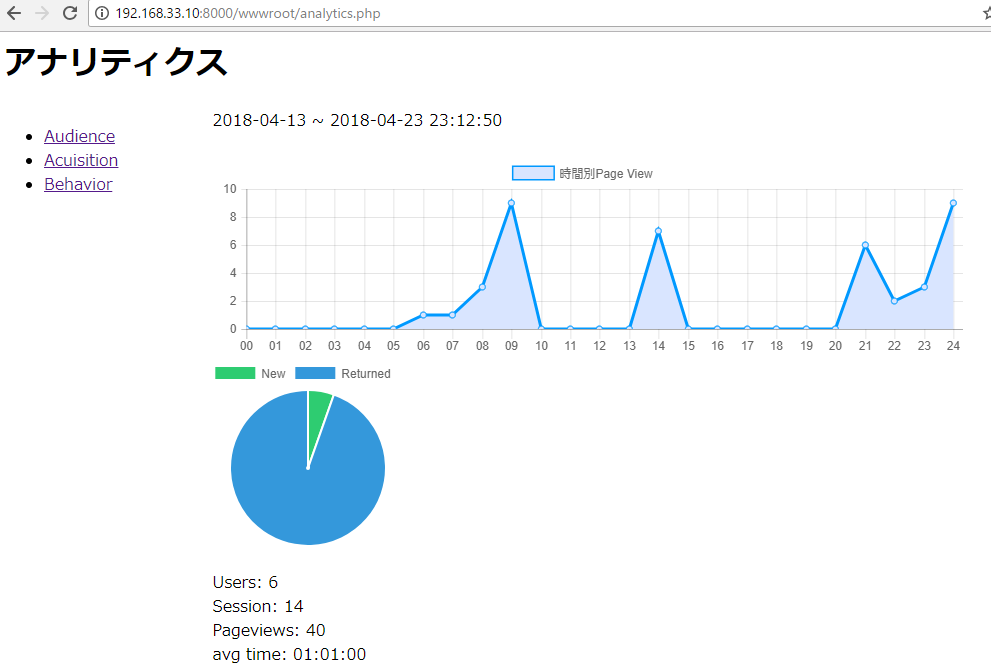
う~ん、なんだろう、この何とも言い難い感じは。。。
1.各指標はボックスレイアウトで表示したい。
2.日付は選択式にしたい
-> gaだと、日付選択は、GETパラメーター使ってますね。
_u.date00=20180420&_u.date01=20180423/

cssをつける
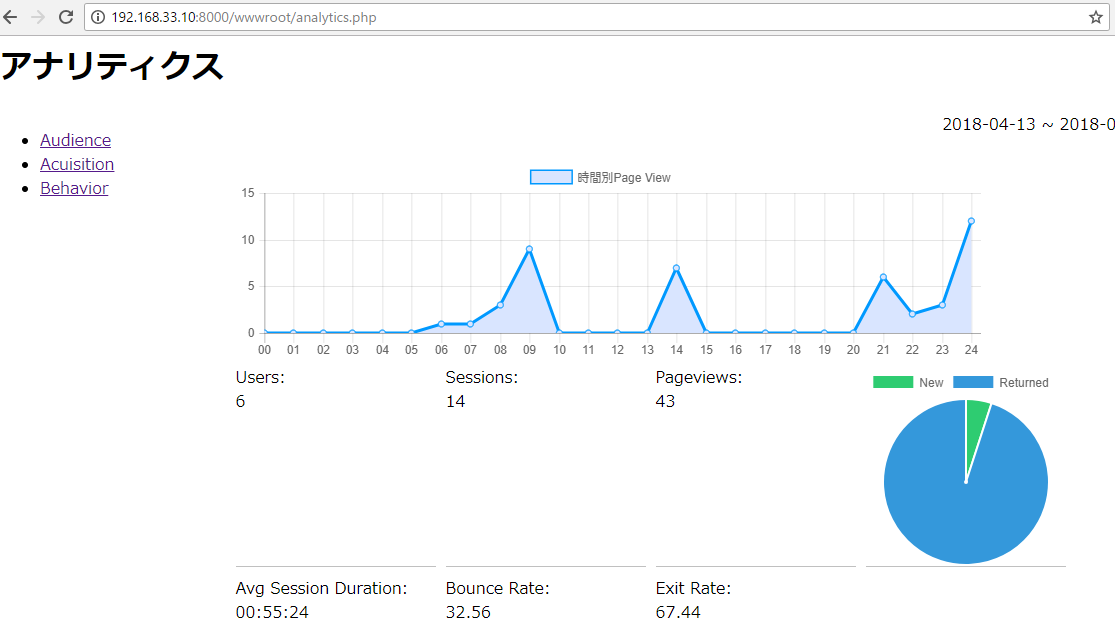
そんなに悪くないような気がしないでもない。

時間ごとの配列をつくる

絶対、もっとうまく書ける筈なんだが。。。

foreach ($cursor as $document) {
  // var_dump($document);
  $pv[] = $document->date;
  $cookie[] = $document->cookie;
  $session[] = $document->session;
  if(!is_null($document->referrer)){
  $avgtime[] = $document->avgtime;
  }
  if(!is_null($document->referrer)){
  $referrer[] = $document->referrer;
  }
  $visit[] = $document->visit;
  $access[] = substr($document->date, 11, 2);
}

$line = array("00"=>0,"01"=>0, "02"=>0,"03"=>0,"04"=>0,"05"=>0,"06"=>0,"07"=>0,"08"=>0,"09"=>0,"10"=>0,"11"=>0,"12"=>0,"13"=>0,"14"=>0,"15"=>0,"16"=>0,"17"=>0,"18"=>0,"19"=>0,"20"=>0,"21"=>0,"22"=>0,"23"=>0);
foreach($access as $value){switch($value){case '00':$line['00'] ++;break;case '01':$line['01'] ++;break;case '02':$line['02'] ++;break;case '03':$line['03'] ++;break;case '04':$line['04'] ++;break;case '05':$line['05'] ++;break;case '06':$line['06'] ++;break;case '07':$line['07'] ++;break;case '08':$line['08'] ++;break;case '08':$line['08'] ++;break;case '10':$line['10'] ++;break;case '11':$line['11'] ++;break;case '12':$line['12'] ++;break;case '13':$line['13'] ++;break;case '14':$line['14'] ++;break;case '15':$line['15'] ++;break;case '16':$line['16'] ++;break;case '17':$line['17'] ++;break;case '18':$line['18'] ++;break;case '19':$line['19'] ++;break;case '20':$line['20'] ++;break;case '21':$line['21'] ++;break;case '22':$line['22'] ++;break;case '23':$line['23'] ++;break;}}
var_dump($line);

悔しいですね。

折れ線グラフをつくる

まず、仮データでつくる。

<style>
#line {
 height:200;
 width:750;
}
</style>
<script src="https://cdnjs.cloudflare.com/ajax/libs/Chart.js/2.1.4/Chart.min.js"></script>
<div id="line">
<canvas id="myChart" width="750" height="200"></canvas>
</div>
<script>
var ctx = document.getElementById("myChart").getContext('2d');
var myChart = new Chart(ctx, {
   type: 'line',
   data: {
      labels: ["00", "01", "02", "03", "04", "05", "06", "07", "08", "09", "10", "11", "12","13","14","15","16","17","18","19","20","21","22","23","24"],
      datasets: [
      {
         label: "Page View",
         borderColor: 'rgb(0, 153, 255)',
         backgroundColor: "#D9E5FF",
         lineTension: 0,
         data: [20, 26, 12, 43, 33, 21, 29, 5, 5, 0, 1,2,2, 3, 4, 5, 5, 5,6, 7, 22, 23, 15, 100, 24],
      },
      ]
   },
   options: {
      responsive: true,
      scales: {
        yAxes: [{
        	ticks: {
            max: 110,
          }
        }]
      }
   }
});
</script>

データラベルが00~24なので、countしたいが、どう組めば一番早い?