platform.js
https://github.com/bestiejs/platform.js
作った方
John-David Dalton
JavaScript tinkerer, bug fixer, & benchmark runner • Creator of Lodash • Former Chakra Perf PM • Current Web Platform DX PM @Microsoft
出たー、@Microsoft!
またかよ、このパターン。。。
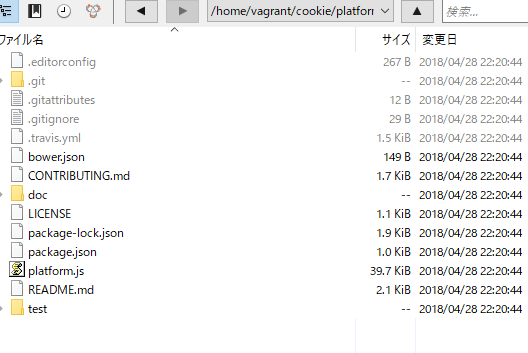
それはさておき、git cloneします。
[vagrant@localhost cookie]$ git clone https://github.com/bestiejs/platform.js.git
Cloning into 'platform.js'...
remote: Counting objects: 2138, done.
remote: Compressing objects: 100% (2/2), done.
remote: Total 2138 (delta 2), reused 1 (delta 1), pack-reused 2135
Receiving objects: 100% (2138/2138), 3.69 MiB | 880.00 KiB/s, done.
Resolving deltas: 100% (1276/1276), done.
Checking connectivity... done.
入りました。
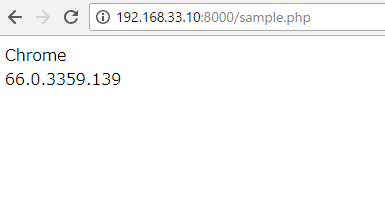
早速使ってみます。
<script src="platformjs/platform.js"></script>
<script type="text/javascript">
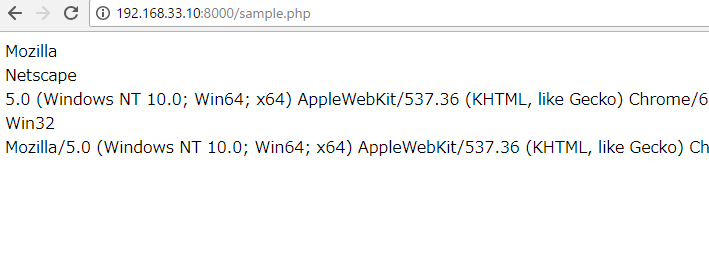
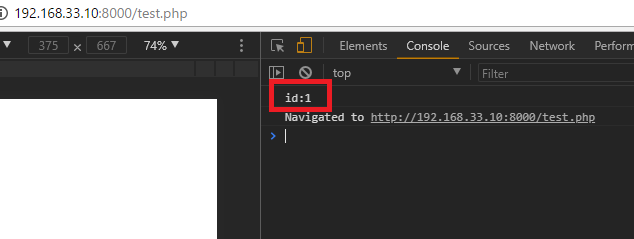
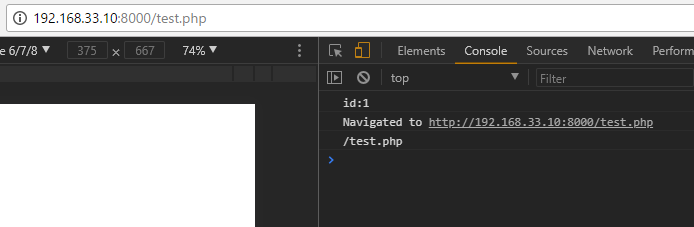
document.write(platform.name + "<br>");
document.write(platform.version + "<br>");
</script>
これこれ、求めてたの!
IEで見てみると、
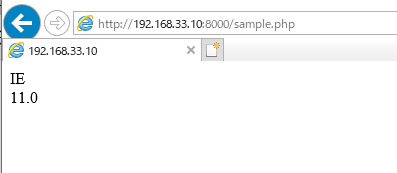
素晴らしい!
ついでに、platform.jsの中身もざっと見てみます。このへんで、labelingしてます。
/* Detectable browser names (order is important). */
    var name = getName([
      'Adobe AIR',
      'Arora',
      'Avant Browser',
      'Breach',
      'Camino',
      'Electron',
      'Epiphany',
      'Fennec',
      'Flock',
      'Galeon',
      'GreenBrowser',
      'iCab',
      'Iceweasel',
      'K-Meleon',
      'Konqueror',
      'Lunascape',
      'Maxthon',
      { 'label': 'Microsoft Edge', 'pattern': 'Edge' },
      'Midori',
      'Nook Browser',
      'PaleMoon',
      'PhantomJS',
      'Raven',
      'Rekonq',
      'RockMelt',
      { 'label': 'Samsung Internet', 'pattern': 'SamsungBrowser' },
      'SeaMonkey',
      { 'label': 'Silk', 'pattern': '(?:Cloud9|Silk-Accelerated)' },
      'Sleipnir',
      'SlimBrowser',
      { 'label': 'SRWare Iron', 'pattern': 'Iron' },
      'Sunrise',
      'Swiftfox',
      'Waterfox',
      'WebPositive',
      'Opera Mini',
      { 'label': 'Opera Mini', 'pattern': 'OPiOS' },
      'Opera',
      { 'label': 'Opera', 'pattern': 'OPR' },
      'Chrome',
      { 'label': 'Chrome Mobile', 'pattern': '(?:CriOS|CrMo)' },
      { 'label': 'Firefox', 'pattern': '(?:Firefox|Minefield)' },
      { 'label': 'Firefox for iOS', 'pattern': 'FxiOS' },
      { 'label': 'IE', 'pattern': 'IEMobile' },
      { 'label': 'IE', 'pattern': 'MSIE' },
      'Safari'
    ]);
line79-81に以下のように書かれています。
// Platform tokens are defined at:
// http://msdn.microsoft.com/en-us/library/ms537503(VS.85).aspx
// http://web.archive.org/web/20081122053950/http://msdn.microsoft.com/en-us/library/ms537503(VS.85).aspx
これまた凄いな、ホントに。
http://msdn.microsoft.com/en-us/library/ms537503(VS.85).aspx