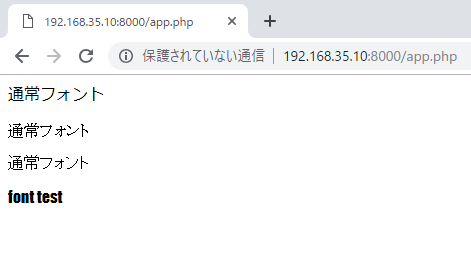
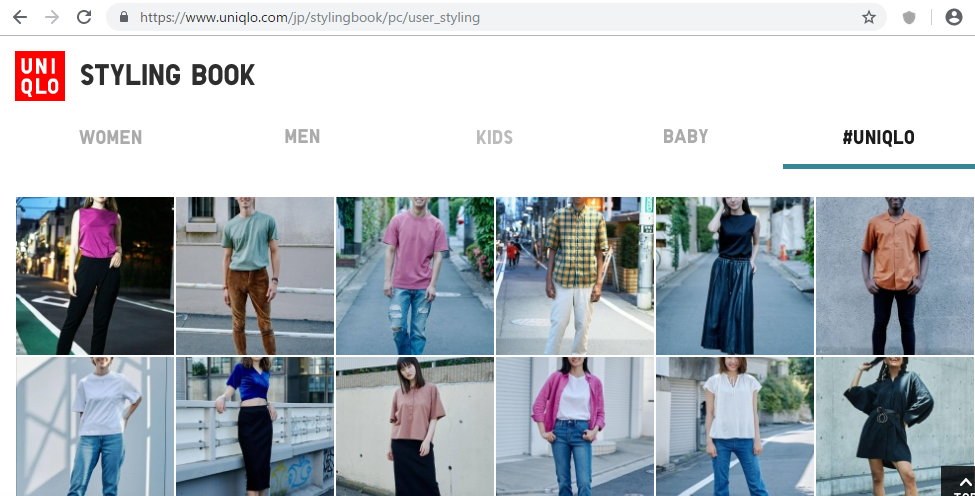
DINはuniquloで使われているフォントだそうです。
https://www.uniqlo.com/jp/stylingbook/pc/user_styling
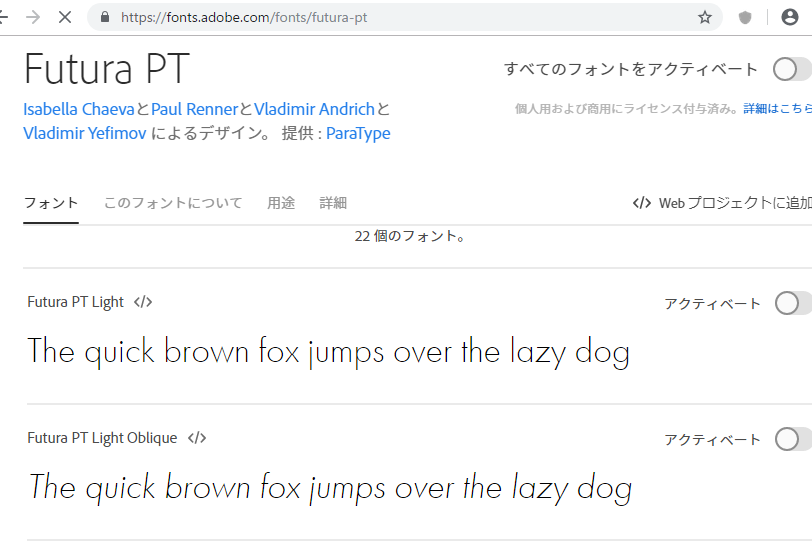
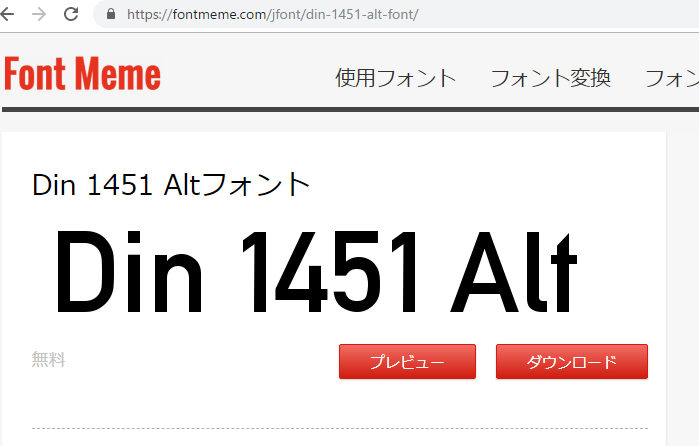
縦に細長いですね。Dinにもいろいろある様です。
「Din 1451 Alt」
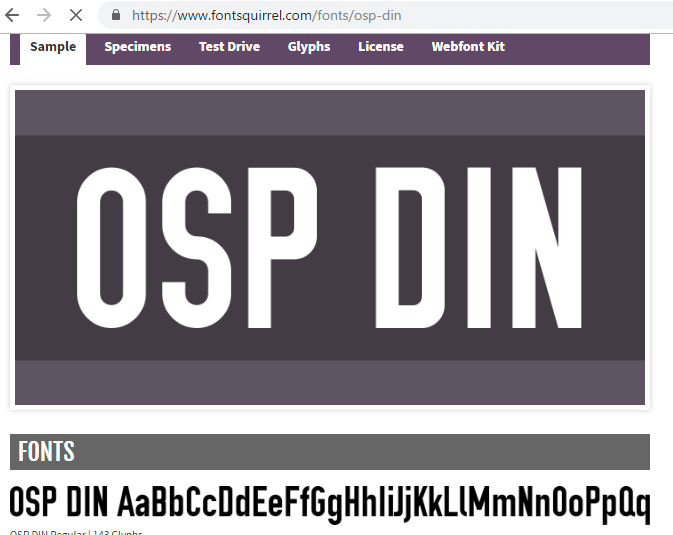
更に細長い?
「OSP DIN」
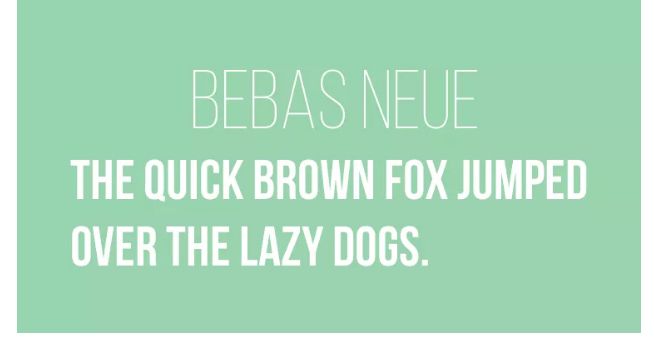
「Bebas Neue」
“DIN” is a german font.
Originally, the font was made for industrial use, and it was said that the purpose was to unify the font such as the model number description in the industry to this “DIN”. So, “DIN” is an abbreviation of “Deutches Institut fur Normung” and Deutsches Institut fur Normung is the officcial name of DIN.
これは目的によるな~
ではユニクロのfontを見てみましょう。
https://www.uniqlo.com/jp/css/default.css
[ccs]
body{
font:13px ‘ヒラギノ角ゴPro W3′,’Hiragino Kaku Gothic Pro’,’游ゴシック’,’Yu Gothic’,’游ゴシック体’,’YuGothic’,メイリオ,Meiryo,sans-serif;
color: #000000;
background: #e6e6e6;
}
[/ccs]
なるほど、ヒラギノ角ゴPro W3か。iPhoneと一緒ですね。
ところで、webデザインの大手ってどこでしょう? IMK?
imjのサイトを見てみましょう。あ、どーでもいいですが、知り合いimjで働いてますね。
で、imsのfont-familyはというと
https://www.imjp.co.jp/resources/css/common.css
body, input, textarea, select, option, button {
  background: #fff;
  font-family: "Gotham SSm A", "Gotham SSm B", "メイリオ", Meiryo, "ヒラギノ角ゴ Pro W3", "Hiragino Kaku Gothic Pro", Osaka, "MS Pゴシック", "MS PGothic", sans-serif;
  font-style: normal;
  line-height: 1.7;
  color: #000;
  font-size: 14px;
}
Gotham SSm A???????????????
なにいいいいいいいいいいいいいいいいいいいいいいいいいいいいい