A/B testing

AB test is using data like user behavior to make a decision.
Which part of the future is better.
AB testing rather than useful for new experiment.

Overview
Example
Choose a metric
Review statistics
Design
Analyze

Examples of when to use A/B testing
・Movie recommendation site: new ranking algorithm
・Change backend-page load time, results users see etc.
・Test layout of initial page

probability
Repeated measurement of click-through-probability
visitors = 1000
unique clicks = 10
click-through-probability ≒10%

Binominal Distribution
@ p = 3/4
mean = P
std dev = √p(1-p)/N
P^ = 16/20 = 4/5

types of outcomes
independent events
identical distribution

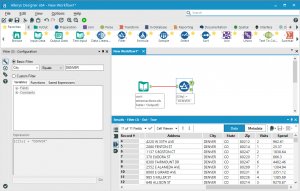
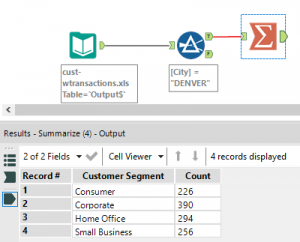
Alteryx

Alteryx: here we go
https://pages.alteryx.com/free-trial.html

sources of data
-transactional, devices, collected

categories of data
-structured, unstructured, semi-structured

structured data
-columns(fields) and rows

Linear Regression

what decision needs to be made?
what information do we need?

tickets per customer per week
past average predict future average
determine the right analytical approach

average number, number of employees, value of contract, industry

linear regression model
-number of employees and number of ticket
– y = mx + b (slope and y-intercept)

calculate a linear equation
y = 0.1833x – 11.055

Business Methodology

Numeric:number (regression model)
Classification:category(non numeric)

ex.
Tricycle Manufacturer

Numeric Model: what type of numeric?
-continuous, time based, count
continuous models, time series analysis

non-numeric -> binary, non-binary

Selecting an Analytical Methodology

methodology map

business problem
-predict outcome, data analysis

Non-predictive Analysis
-Geospatial, Segmentation, Aggregation, Descriptive

geospatial analysis:types off non-predictive data analysis
-location base data, geographic data
Segmentation Analysis
-grouping together
Aggregation Analysis
-calculating a value across a group or dimention
Descriptive Analysis
-descriptive statistics provides simple summaries of a data sample
-mean, median, mode, standard deviation, interquartile range

Predictive Business Problems
– do you have data on what you are trying to predict?

Data Rich vs. Data Poor
-do not have useful data to solve problems
-experiment is business context, a/b test, estimate sales of new product

The Analytical Problem Solving Framework

-Strategy for solving problems
-Non-predictive data Analysis
-Predictive Analysis
-Linear Regressions

Framwork(cross industry standard process for data mining)
business issue understanding, data understanding, data preparation, analysis modeling, validation, personalization

business issue understanding:what decision needs to be made?
what information is needed to inform that decision?
what type of analysis will provide the information to inform that decision?

how can we predict hourly temperatures?
what data is needed?
what data is available?
what are the important of the data?

data preparation
-gather, cleanse, format, blend & combine, sample

analysis modeling
-predict temperature, predict electricity usage
build predictive model, validate model, repeat process, perform analysis

validation
presentation and visualization

Data Analysis Process

extract -> clean -> explore -> analyze -> share

Bar graphs, Histograms, Scatter plots
Geospatial plots, Choropleth, Cartogram, Small multiples, Box plots, violin plots
Strip charts

choosing a good chart
http://extremepresentation.typepad.com/blog/2006/09/choosing_a_good.html

Bullet graphs, Sparkline, Connected scatter plot, Kernel density estimate, Cycle plots
Using color, Color palettes, Sequential palettes, Diverging palettes, Palettes for qualitative data

lie factor = size of effect shown in graphic / size of effect in data