まず、GCPにBigQueryにTMCNの価格を入れます。
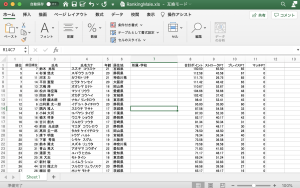
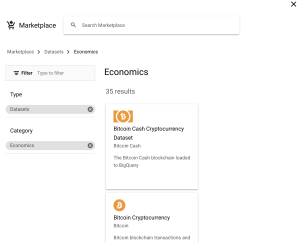
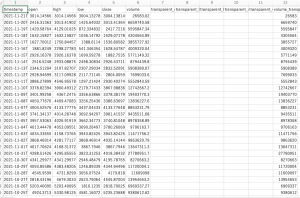
1. nomics.comというサイトからFree CSVをdownload
https://nomics.com/assets/tmcn-timecoin-protocol
直近100日分のデータを取得できる。timestamp, open, hight, low, close, volumeなど、一般的なデータ形式。
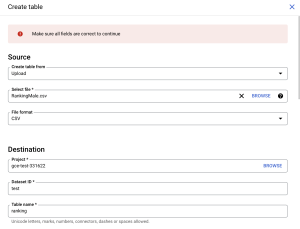
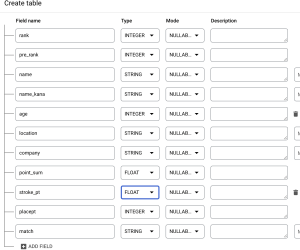
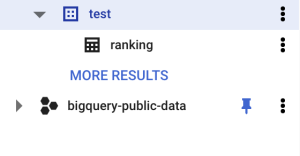
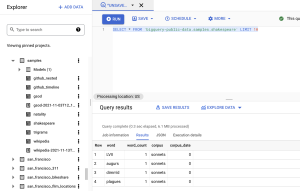
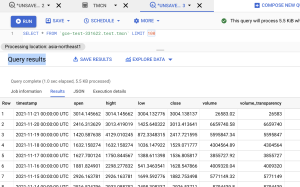
2. GCPのBigQueryにDownloadしたtmcnのデータをimport
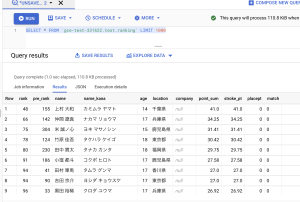
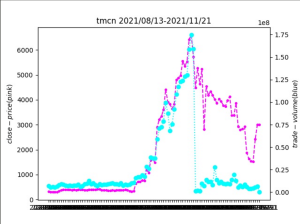
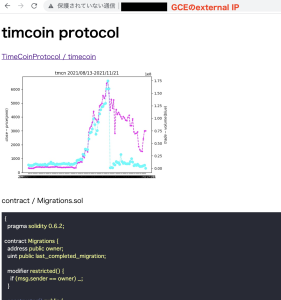
3. PythonでGCP BigQueryからデータを取得して、matplotlibで2軸の折れ線グラフを作る
from google.cloud import bigquery
import matplotlib.pyplot as plt

client = bigquery.Client.from_service_account_json('./client_credentials.json')

QUERY = (
    'SELECT * FROM `gce-test-331622.test.tmcn` ORDER BY timestamp ASC LIMIT 100')
query_job = client.query(QUERY)
rows = query_job.result()

x = []
y1 = []
y2 = []
for row in rows:
    print(str(row.timestamp)[0:10] + " close:" + str(row.close) + " volume:" + str(row.volume))
    date = str(row.timestamp)[0:10]
    x.append(date)
    y1.append(row.close)
    y2.append(row.volume)

plt.figure(figsize=(10,8))
fig, ax1 = plt.subplots()
ax2 = ax1.twinx()

plt.title("tmcn 2021/08/13-2021/11/21")

ax1.plot(x, y1, marker=".", color = "magenta", linestyle = "--")
ax1.set_ylabel('$close-price(pink)$')
ax2.plot(x, y2, marker="o", color = "cyan", linestyle = ":")
ax2.set_ylabel('$trade-volume(blue)$')

plt.savefig('img/tmcn.jpg',dpi=100)
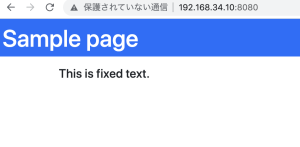
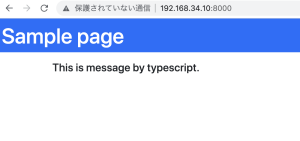
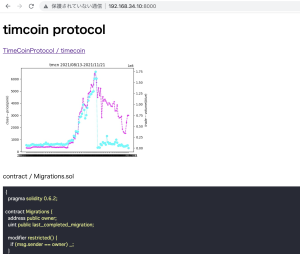
4. 作成した画像をHTMLで表示
	<h1>timcoin protocol</h1>
	<a href="https://github.com/TimeCoinProtocol/timecoin">TimeCoinProtocol / timecoin</a><br>
	<img src="img/tmcn.jpg" width="400" height="300">
// 省略
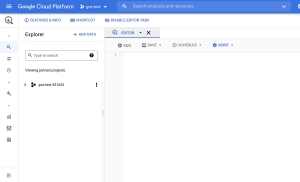
5. Githubにpushして、Google Cloud DeployでGCEにデプロイする
steps:
- name: 'gcr.io/google.com/cloudsdktool/cloud-sdk'
  entrypoint: gcloud
  args: ['compute', 'scp', '--recurse', 'img', 'instance-1:/var/www/html/img' , '--zone','asia-northeast1-a']
- name: 'gcr.io/google.com/cloudsdktool/cloud-sdk'
  entrypoint: gcloud
  args: ['compute', 'scp', '--recurse', 'index.html', 'instance-1:/var/www/html/index.html' , '--zone','asia-northeast1-a']
cloudbuild.yamlで以下のように書くと、argsは下のargsしか実行されないので、2回書かなければならないので注意が必要
steps:
- name: 'gcr.io/google.com/cloudsdktool/cloud-sdk'
  entrypoint: gcloud
  args: ['compute', 'scp', '--recurse', 'img', 'instance-1:/var/www/html/img' , '--
  args: ['compute', 'scp', '--recurse', 'index.html', 'instance-1:/var/www/html/index.html' , '--zone','asia-northeast1-a']
うーむ、データ量が多い時などはBigQueryは使えそうだにゃーーーーーーーー