IFRSの特徴
◆原則主義(プリンシプル・ベース)
IFRSは、財務報告に関する原理・原則を明らかにするとともに、例外規定は極力認めず、その解釈や運用は、企業の 判断に任せる考え方です。一方、日本基準は、詳細で具体的な規定や数値基準を設ける対照的な「細則主義(ルール・ベース)」と云う考え方で、制定されています。
◆資産・負債アプローチ
IFRSは、資産・負債の評価とその差額としての純資産、つまり、財政状態計算書に計上されている財産価値を重視しています。その財産価値の、会計期間の期首から期末までに増加した(または減少した部分を利益(または損失)として認識します。利益算出の考え方を「資産・負債アプローチ」と云います。そしてこの認識された利益は「包括利益」と呼ばれています。
従来の日本基準では、収益から費用を差し引いた利益を重視し、その計上された純利益の結果、純資産が増加すると云う考え方で、これを「収益・費用アプローチ」と云います。
◆公正価値アプローチ
IFRSでは、将来の経済的便益の提供能力の算定と云う考え方から、公正価値による評価が重視されます。公正価値は、「・・・・・当事者間で資産が交換され、負債が決済される価額」と定義されますが、平たく云えば、「時価」を指しますが、IFRSでは、資産や負債の公正価値変動額が「包括利益」の一部を構成しますので、「資産・負債アプローチ」と資産・負債の公正価値評価と包括利益の算定には密接な関係があります
◆その他、財報告における経営管理区分(セグメント)を重視した「セグメント・アプローチ」(日本基準でもセグメント情報に採用済み)、財務情報の比較可能性の重視、形式より実質(実態)を優先して、企業の経済的実態をを明らかにしようとしている考え方等がIFRS基準書全体に共通する特徴となっています。
為替レートは?
IFRSでは、まず機能通貨を決定し、機能通貨による帳簿記入を行う
-売上に関連する通貨
財貨及び役務の販売価格に大きく影響を与える通貨
競争力及び規制が財貨と役務の販売価格を主に決定することになる国の通貨
-仕入に関連する通貨
労務費、材料費や財貨や役務を提供するためのその他の原価に主に影響を与える通貨
外貨建貨幣性項目:決算日の為替レート
取得原価で測定される外貨建非貨幣性項目:取引日の為替レート
公正価値で測定される外貨建非貨幣性項目:公正価値で測定された日の為替レート
外貨建取引は、取引日における当該外貨と機能通貨の間の換算は、原則、取引日レートで行い認識します。
なるほど、為替レートはAPIで取得してもダメということですね。
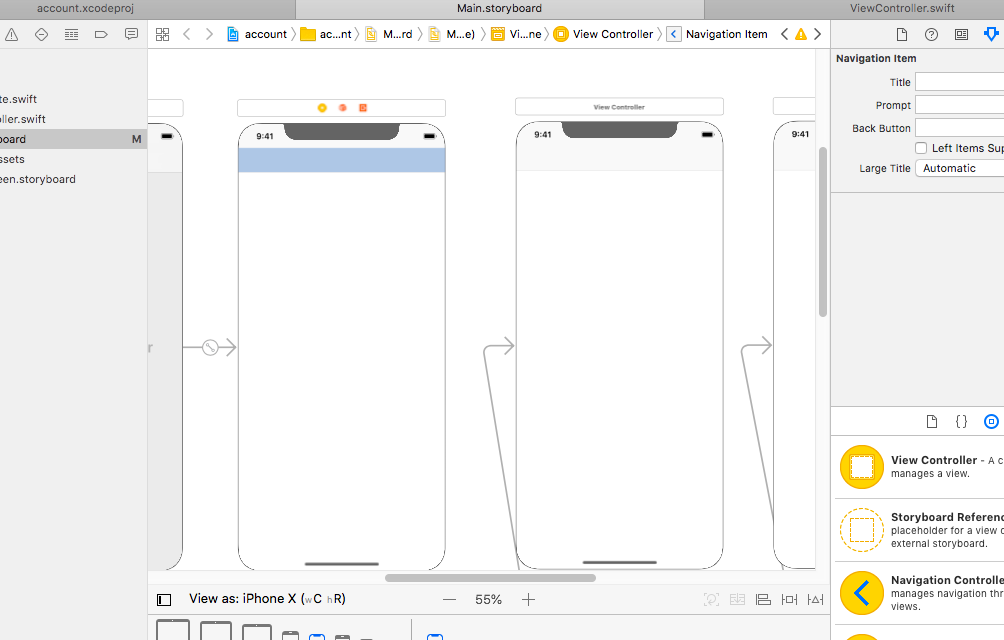
view controller と navigation controllerを配置していきます。