
import urllib.request as req
local = "mushroom.csv"
url = "https://archive.ics.uci.edu/ml/machine-learning-databases/mushroom/agaricus-lepiota.data"
req.urlretrieve(url, local)
print("ok")
bmi
import random
def calc_bmi(h, w):
bmi = w / (h / 100) ** 2
if bmi < 18.5: return "thin"
if bmi < 25: return "normal"
return "fat"
fp = open("bmi.csv", "w", encoding="utf-8")
fp.write("height, weight, label\r\n")
cnt = {"thin":0, "normal":0, "fat":0}
for i in range(20000):
h = random.randint(120, 200)
w = random.randint(35, 80)
label = calc_bmi(h, w)
cnt[label] += 1
fp.write("{0},{1},{2}\r\n".format(h, w, label))
fp.close()
print("ok", cnt)
[/python]
[python]
from sklearn import cross_validation, svm, metrics
import matplotlib.pyplot as plt
import pandas as pd
tbl = pd.read_csv("bmi.csv")
label = tbl["label"]
w = tbl["weight"] / 100
h = tbl["height"] / 200
wh = pd.concat([w, h], axis=1)
data_train, data_test, label_train, label_test = \
cross_validation.train_test_split(wh, label)
clf = svm.SVC()
clf.fit(data_train, label_train)
predict = clf.predict(data_test)
ac_score = metrics.accuracy_score(label_test, predict)
cl_report = metrics.classification_report(label_test, predict)
print("正解率=", ac_score)
print("レポート=\n", cl_report)
[/python]
[python]
import matplotlib.pyplot as plt
import pandas as pd
tbl = pd.read_csv("bmi.csv", index_col=2)
fig = plt.figure()
ax = fig.add_subplot(1, 1, 1)
def scatter(lbl, color):
b = tbl.loc[lbl]
ax.scatter(b["weight"],b["height"], c=color, label=lbl)
scatter("fat", "red")
scatter("normal", "yellow")
scatter("thin", "purple")
ax.legend()
plt.savefig("bmi-test.png")
[/python]
PermissionError: [Errno 13] Permission denied: ‘/train-images-idx3-ubyte.gz’
import urllib.request as req
import gzip, os, os.path

savepath = "./mnist"
baseurl = "http://yann.lecun.com/exdb/mnist"
files = [
	"train-images-idx3-ubyte.gz",
	"train-labels-idx1-ubyte.gz",
	"t10k-images-idx3-ubyte.gz",
	"t10k-labels-idx1-ubyte.gz"]

if not os.path.exists(savepath): os.mkdir(savepath)
for f in files:
	url = baseurl + "/" + f
	loc = savepath = "/" + f
	print("download:", url)
	if not os.path.exists(loc):
		req.urlretrieve(url, loc)

for f in files:
	gz_file = savepath + "/" + f
	raw_file = savepath + "/" + f.replace(".gz", "")
	print("gzip:", f)
	with gzip.open(gz_file, "rb") as fp:
		body = fp.read()
		with open(raw_file, "wb") as w:
			w.write(body)
print("ok")
[vagrant@localhost python]$ python3 app.py
download: http://yann.lecun.com/exdb/mnist/train-images-idx3-ubyte.gz
Traceback (most recent call last):
File “app.py”, line 18, in
req.urlretrieve(url, loc)
File “/home/vagrant/.pyenv/versions/3.5.2/lib/python3.5/urllib/request.py”, line 198, in urlretrieve
tfp = open(filename, ‘wb’)
PermissionError: [Errno 13] Permission denied: ‘/train-images-idx3-ubyte.gz’
何故だ!?
from sklearn import svm, metrics
import glob, os.path, re, json
def check_freq(fname):
name = os.path.basename(fname)
lang = re.match(r’^[a-z]{2,}’, name).group()
wtih open(fname, “r”, encoding=”utf-8″) as f:
text = f.read()
text = text.lower()
cnt = [0 for n in range(0, 26)]
code_a = ord(“a”)
code_z = ord(“z”)
for ch in text:
n = ord(ch)
if code_a <= n <= code_z:
cnt[n - code_a] += 1
total = sum(cnt)
freq = list(map(lambda n: n / total, cnt))
return (freq, lang)
def load_files(path):
freqs = []
labels = []
file_list = glob.glob(path)
for fname in file_list:
r = check_freq(fname)
freqs.append(r[0])
labels.append(r[1])
return {"freqs":freqs, "labels":labels}
data = load_files("./lang/train/*.txt")
test = load_files("./lang/test/*.txt")
with open("./lang/freq.json", "w", encoding="utf-8") as fp:
json.dump([data, test], fp)
clf = svm.SVC()
clf.fit(data["freqs"], data["labels"])
predict = clf.predict(test["freqs"])
sc_score = metrics.accuracy_score(test["labels"], predict)
cl_report = metrics.classification_report(test["labels"], predict)
print("正解率=", ac_score)
print("レポート=")
print(cl_report)
[/python]
[python]
import matplotlib.pyplot as plt
import pandas as pd
import json
with open("./lang/freq.json", "r", encoding="utf-8") as fp:
freq = json.load(fp)
lang_dic = {}
for i, lbl in enumerate(freq[0]["labels"]):
fq = freq[0]["freqs"][i]
if not (lbl in lang_dic):
lang_dic[lbl] = fq
continue
for idx, v in enumerate(fq):
lang_dic[lbl][idx] = (lang_dic[lbl][idx] + v) / 2
asclist = [[chr(n) for n in range(97,97+26)]]
df = pd.DataFrame(lang_dic, index=asclist)
plt.style.use('ggplot')
df.plot(kind="bar", subplots=True, ylim=(0,0.15))
plt.savefig("lang-plot.png")
[/python]
[python]
from sklearn import svm
from sklearn.externals import joblib
import json
with open("./lang/freq.json", "r", encoding="utf-8") as fp:
d = json.load(fp)
data = d[0]
clf = svm.SVC()
clf.fit(data["freqs"], data["labels"])
joblib.dump(clf, "./cgi-bin/freq.pkl")
print("ok")
[/python]
アヤメの品種分類
GitHubからcsvをダウンロードします
https://github.com/pandas-dev/pandas/tree/master/pandas/tests/data
from sklearn import svm, metrics
import random, re
csv = []
with open(‘iris.csv’, ‘r’, encoding=’utf-8′) as fp:
for line in fp:
line = line.strip()
cols = line.split(‘,’)
fn = lambda n : float(n) if re.match(r’^[0-9\.]+$’, n) else n
cols = list(map(fn, cols))
csv.append(cols)
del csv[0]
random.shuffle(csv)
total_len = len(csv)
train_len = int(total_len * 2 / 3)
train_data = []
train_label = []
test_data = []
test_label = []
for i in range(total_len):
data = csv[i][0:4]
label = csv[i][4]
if i < train_len:
train_data.append(data)
train_label.append(label)
else:
test_data.append(data)
test_label.append(label)
clf = svm.SVC()
clf.fit(train_data, train_label)
pre = clf.predict(test_data)
ac_score = metrics.accuracy_score(test_label, pre)
print("正解率=", ac_score)
[/python]
[vagrant@localhost python]$ python3 app.py
return f(*args, **kwds)
正解率= 0.96
[python]
import pandas as pd
from sklearn import svm, metrics, cross_validation
csv = pd.read_csv('iris.csv')
csv_data = csv[["SepalLength","SepalWidth","PetalLength","PetalWidth"]]
csv_label = csv["Name"]
train_data, test_data, train_label, test_label = \
cross_validation.train_test_split(csv_data, csv_label)
clf = svm.SVC()
clf.fit(train_data, train_label)
pre = clf.predict(test_data)
ac_score = metrics.accuracy_score(test_label, pre)
print("正解率=", ac_score)
[/python]
[vagrant@localhost python]$ python3 app.py
正解率= 0.9736842105263158
手書きでイラスト
段々イラストレーターさんと仕事する機会も出てきましたね。何故かわかりませんが。
ある方に、イラストを描いてみたら、と薦められたので、
可愛い魔女

うううう、難しい。。。
ImportError: No module named ‘_tkinter’
from sklearn import datasets

digits = datasets.load_digits()

import matplotlib.pyplot as plt
plt.matshow(digits.images[0], cmap="Greys")
plt.show()
[vagrant@localhost python]$ python3 app.py
…
import _tkinter # If this fails your Python may not be configured for Tk
ImportError: No module named ‘_tkinter’
pyenv上python3.5.2環境でtkinterを利用できるようにしないといけないということですね。
scikit-learnのアルゴリズム
画像認識はこちらになりますね。
Classification : Identifying to which category an object belongs to.
SVM, nearest neighbors, random forest, …
Spam detection, Image recognition.
株価の予測はこちらでしょうか。
Regression:Predicting a continuous-valued attribute associated with an object.
SVR, ridge regression, Lasso, …
Drug response, Stock prices.
属性の分類はこちらです。Web解析でデモグラフィックをグルーピングするにはこちらでしょうね。
Clustering:Automatic grouping of similar objects into sets.
k-Means, spectral clustering, mean-shift, …
Customer segmentation, Grouping experiment outcomes
これは、よくわかりません。変数を減らしていく、ビジュアリゼーションと記載がありますね。。
Dimensionality reduction:Reducing the number of random variables to consider.
Algorithms: PCA, feature selection, non-negative matrix factorization.
Visualization, Increased efficiency
これもあまり馴染みがないですね。モデリングの調整ということは理解ができますが。
Model selection:Comparing, validating and choosing parameters and models.
grid search, cross validation, metrics.
Improved accuracy via parameter tuning
テキストを機械学習に組み込むと書いてますね。どういうことでしょうか。翻訳の精度を上げるとかでしょうか。これは、形態素解析と組み合わせるのでしょうか。面白そうな分野ではありますね。
Preprocessing:Feature extraction and normalization.
preprocessing, feature extraction.
Transforming input data such as text for use with machine learning algorithms.
ということで、Classification、 Regression、Clusteringは割と一般的なモデリングだと思います。
初期は辛いですね。
とにかく量をこなさないと、どうやって学習していったらいいかすらわかりません。
scikit-learnを学ぼう
ホームページから見ていきます
http://scikit-learn.org/stable/
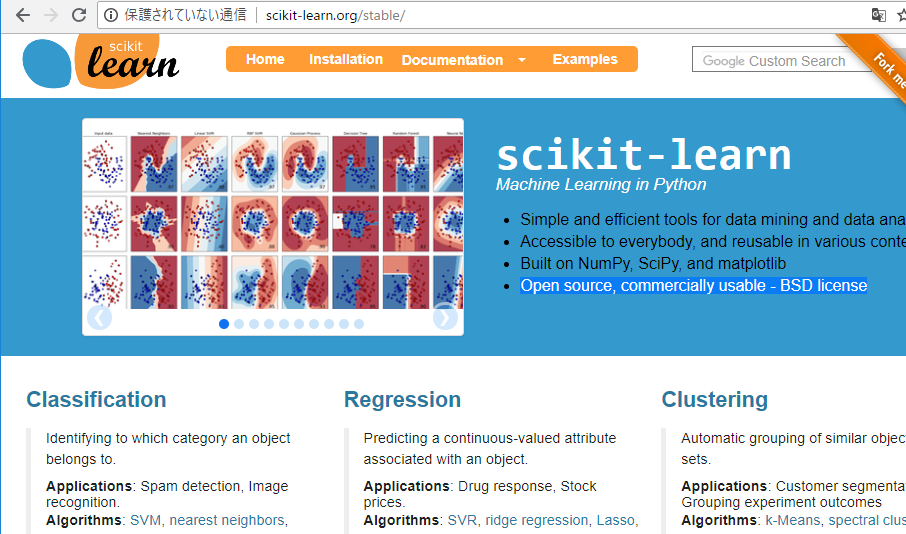
-Simple and efficient tools for data mining and data analysis
-Accessible to everybody, and reusable in various contexts
-Built on NumPy, SciPy, and matplotlib
-Open source, commercially usable – BSD license
BSD license ってあまりみませんね。
BSD license:カリフォルニア大学によって策定され、同大学のバークレー校内の研究グループ、Computer Systems Research Groupが開発したソフトウェア群であるBSDなどで採用されている。「無保証」であることの明記と著作権およびライセンス条文自身の表示を再頒布の条件とするライセンス規定である。この条件さえ満たせば、BSDライセンスのソースコードを複製・改変して作成したオブジェクトコードをソースコードを公開せずに頒布できる。
著作権・免責の表示が必要ということですね。
sklearn import pandas
import pandas as pd
from sklearn import svm, metrics

xor_input = [
	[0, 0, 0],
	[0, 1, 1],
	[1, 0, 1],
	[1, 1, 0]
]

xor_df = pd.DataFrame(xor_input)
xor_data = xor_df.ix[:,0:1]
xor_label = xor_df.ix[:,2]

clf = svm.SVC()
clf.fit(xor_data, xor_label)
pre = clf.predict(xor_data)

ac_score = metrics.accuracy_score(xor_label, pre)
print(" 正解率=", ac_score)
[vagrant@localhost python]$ python3 app.py
/home/vagrant/.pyenv/versions/3.5.2/lib/python3.5/importlib/_bootstrap.py:222: RuntimeWarning: numpy.dtype size changed, may indicate binary incompatibility. Expected 96, got 88
return f(*args, **kwds)
/home/vagrant/.pyenv/versions/3.5.2/lib/python3.5/importlib/_bootstrap.py:222: RuntimeWarning: numpy.dtype size changed, may indicate binary incompatibility. Expected 96, got 88
return f(*args, **kwds)
/home/vagrant/.pyenv/versions/3.5.2/lib/python3.5/importlib/_bootstrap.py:222: RuntimeWarning: numpy.dtype size changed, may indicate binary incompatibility. Expected 96, got 88
return f(*args, **kwds)
/home/vagrant/.pyenv/versions/3.5.2/lib/python3.5/importlib/_bootstrap.py:222: RuntimeWarning: numpy.dtype size changed, may indicate binary incompatibility. Expected 96, got 88
return f(*args, **kwds)
/home/vagrant/.pyenv/versions/3.5.2/lib/python3.5/importlib/_bootstrap.py:222: RuntimeWarning: numpy.dtype size changed, may indicate binary incompatibility. Expected 96, got 88
return f(*args, **kwds)
/home/vagrant/.pyenv/versions/3.5.2/lib/python3.5/importlib/_bootstrap.py:222: RuntimeWarning: numpy.dtype size changed, may indicate binary incompatibility. Expected 96, got 88
return f(*args, **kwds)
正解率= 1.0
こりゃあかん、プログラミングやり始めた時と全く同じだ。
何故こう動いているか理解できん。
scikit-learnのfit()メソッドを使う
いきなりコードから始めます。
from sklearn import svm

xor_data = [
		[0, 0, 0],
		[0, 1, 1],
		[1, 0, 1],
		[1, 1, 0]
]

data = []
label = []
for row in xor_data:
	p = row[0]
	q = row[1]
	r = row[2]
	data.append([p, q])
	label.append(r)

clf = svm.SVC()
clf.fit(data, label)

pre = clf.predict(data)
print("予測結果:", pre)

ok = 0; total = 0
for idx, answer in enumerate(label):
	p = pre[idx]
	if p == answer: ok += 1
	total += 1
print("正解率:", ok, "/", total, "=", ok/total)
続いてコマンドライン
[vagrant@localhost python]$ python3 app.py
/home/vagrant/.pyenv/versions/3.5.2/lib/python3.5/importlib/_bootstrap.py:222: RuntimeWarning: numpy.dtype size changed, may indicate binary incompatibility. Expected 96, got 88
return f(*args, **kwds)
/home/vagrant/.pyenv/versions/3.5.2/lib/python3.5/importlib/_bootstrap.py:222: RuntimeWarning: numpy.dtype size changed, may indicate binary incompatibility. Expected 96, got 88
return f(*args, **kwds)
/home/vagrant/.pyenv/versions/3.5.2/lib/python3.5/importlib/_bootstrap.py:222: RuntimeWarning: numpy.dtype size changed, may indicate binary incompatibility. Expected 96, got 88
return f(*args, **kwds)
/home/vagrant/.pyenv/versions/3.5.2/lib/python3.5/importlib/_bootstrap.py:222: RuntimeWarning: numpy.dtype size changed, may indicate binary incompatibility. Expected 96, got 88
return f(*args, **kwds)
予測結果: [0 1 1 0]
正解率: 4 / 4 = 1.0
なんだこりゃ、いきなり一気に難易度が上がった?!
scikit-learn -> Pythonの機械学習ライブラリ