[vagrant@localhost www]$ git clone https://github.com/zendframework/ZendSkeletonApplication.git
fatal: could not create work tree dir ‘ZendSkeletonApplication’.: Permission denied
[vagrant@localhost www]$ sudo git clone https://github.com/zendframework/ZendSkeletonApplication.git
Initialized empty Git repository in /var/www/ZendSkeletonApplication/.git/
remote: Enumerating objects: 7, done.
remote: Counting objects: 100% (7/7), done.
remote: Compressing objects: 100% (6/6), done.
remote: Total 3743 (delta 1), reused 4 (delta 1), pack-reused 3736
Receiving objects: 100% (3743/3743), 2.61 MiB | 1.17 MiB/s, done.
Resolving deltas: 100% (1772/1772), done.
[vagrant@localhost www]$ ls
ZendSkeletonApplication cgi-bin error html icons
[vagrant@localhost www]$ cd ZendSkeletonApplication
[vagrant@localhost ZendSkeletonApplication]$ ls
CONDUCT.md README.md composer.lock module
CONTRIBUTING.md TODO.md config phpcs.xml
Dockerfile Vagrantfile data phpunit.xml.dist
LICENSE.md composer.json docker-compose.yml public
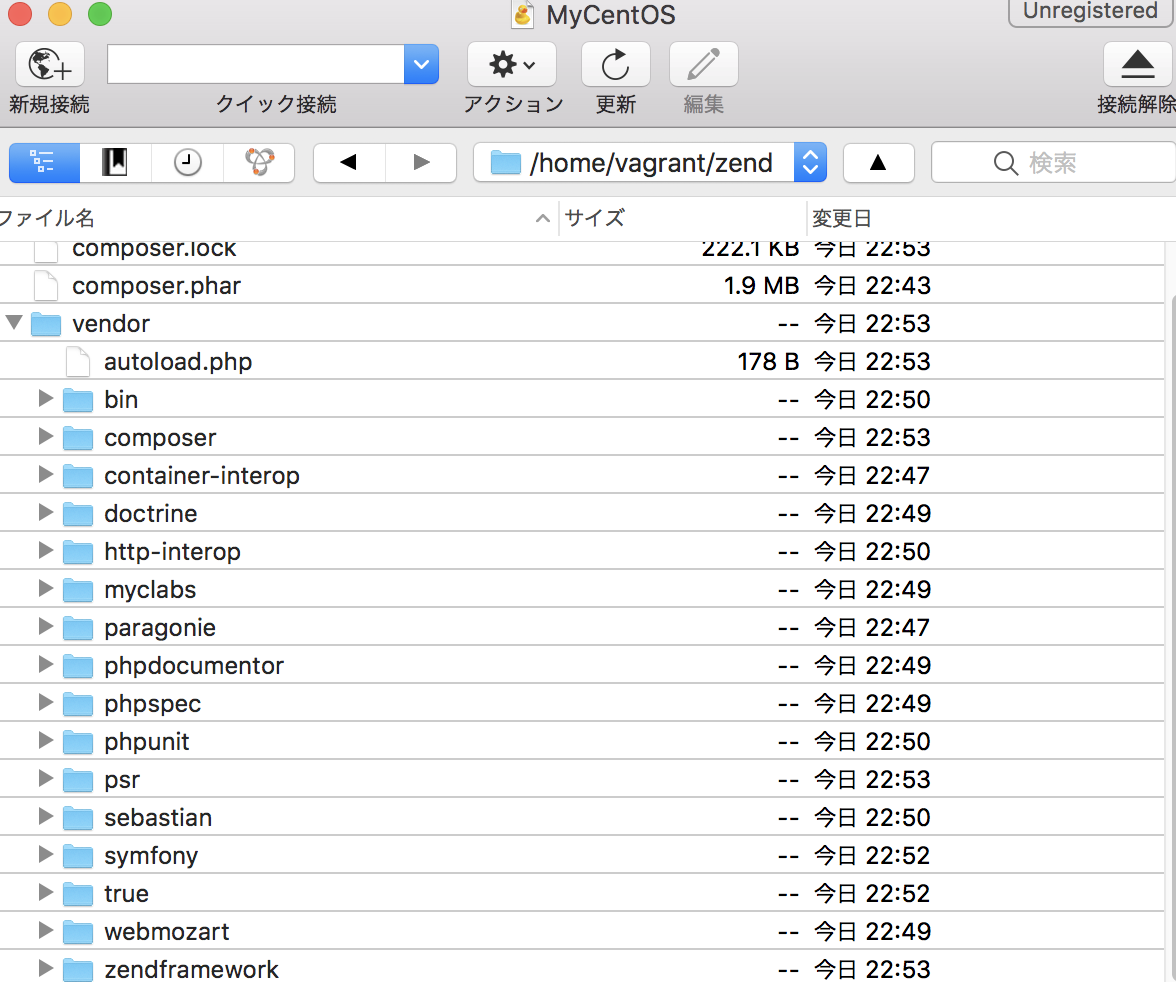
[vagrant@localhost ZendSkeletonApplication]$ sudo cp -r /home/vagrant/zend/zf2/vendor vendor
[vagrant@localhost ZendSkeletonApplication]$ ls
CONDUCT.md README.md composer.lock module vendor
CONTRIBUTING.md TODO.md config phpcs.xml
Dockerfile Vagrantfile data phpunit.xml.dist
LICENSE.md composer.json docker-compose.yml public
[vagrant@localhost ZendSkeletonApplication]$ cd public
[vagrant@localhost public]$ ls
css fonts img index.php js web.config
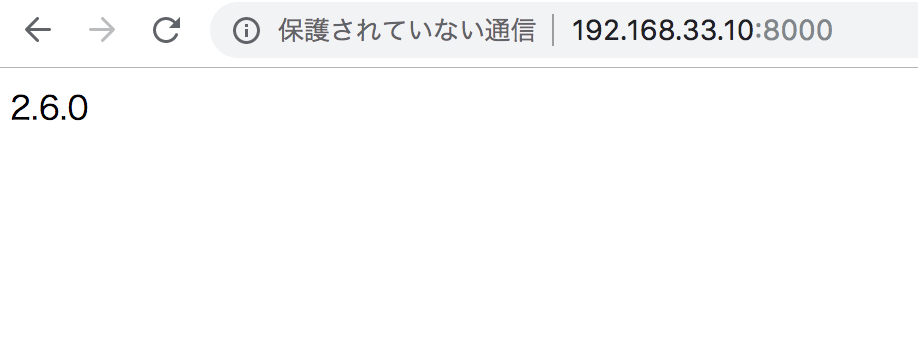
[vagrant@localhost public]$ php -S 192.168.33.10:8000
PHP 5.6.40 Development Server started at Thu Aug 1 23:56:44 2019
Listening on http://192.168.33.10:8000
Document root is /var/www/ZendSkeletonApplication/public
Press Ctrl-C to quit.
[Thu Aug 1 23:56:47 2019] PHP Fatal error: Uncaught exception ‘Zend\ModuleManager\Exception\RuntimeException’ with message ‘Module (Application) could not be initialized.’ in /var/www/ZendSkeletonApplication/vendor/zendframework/zend-modulemanager/src/ModuleManager.php:203
Stack trace:
#0 /var/www/ZendSkeletonApplication/vendor/zendframework/zend-modulemanager/src/ModuleManager.php(175): Zend\ModuleManager\ModuleManager->loadModuleByName(Object(Zend\ModuleManager\ModuleEvent))
#1 /var/www/ZendSkeletonApplication/vendor/zendframework/zend-modulemanager/src/ModuleManager.php(97): Zend\ModuleManager\ModuleManager->loadModule(‘Application’)
#2 /var/www/ZendSkeletonApplication/vendor/zendframework/zend-eventmanager/src/EventManager.php(322): Zend\ModuleManager\ModuleManager->onLoadModules(Object(Zend\ModuleManager\ModuleEvent))
#3 /var/www/ZendSkeletonApplication/vendor/zendframework/zend-eventmanager/src/EventManager.php(171): Zend\EventManager\EventManager->triggerListeners(Object(Zend\ModuleManager\ModuleEvent))
#4 /var/www/ZendSkeletonApplication/vendo in /var/www/ZendSkeletonApplication/vendor/zendframework/zend-modulemanager/src/ModuleManager.php on line 203
[Thu Aug 1 23:56:47 2019] 192.168.33.1:56286 [500]: / – Uncaught exception ‘Zend\ModuleManager\Exception\RuntimeException’ with message ‘Module (Application) could not be initialized.’ in /var/www/ZendSkeletonApplication/vendor/zendframework/zend-modulemanager/src/ModuleManager.php:203
Stack trace:
#0 /var/www/ZendSkeletonApplication/vendor/zendframework/zend-modulemanager/src/ModuleManager.php(175): Zend\ModuleManager\ModuleManager->loadModuleByName(Object(Zend\ModuleManager\ModuleEvent))
#1 /var/www/ZendSkeletonApplication/vendor/zendframework/zend-modulemanager/src/ModuleManager.php(97): Zend\ModuleManager\ModuleManager->loadModule(‘Application’)
#2 /var/www/ZendSkeletonApplication/vendor/zendframework/zend-eventmanager/src/EventManager.php(322): Zend\ModuleManager\ModuleManager->onLoadModules(Object(Zend\ModuleManager\ModuleEvent))
#3 /var/www/ZendSkeletonApplication/vendor/zendframework/zend-eventmanager/src/EventManager.php(171): Zend\EventManager\EventManager->triggerListeners(Object(Zend\ModuleManager\ModuleEvent))
#4 /var/www/ZendSkeletonApplication/vendo in /var/www/ZendSkeletonApplication/vendor/zendframework/zend-modulemanager/src/ModuleManager.php on line 203
[Thu Aug 1 23:57:00 2019] 192.168.33.1:56287 Invalid request (Unexpected EOF)
[Thu Aug 1 23:57:00 2019] 192.168.33.1:56288 Invalid request (Unexpected EOF)
application.config?
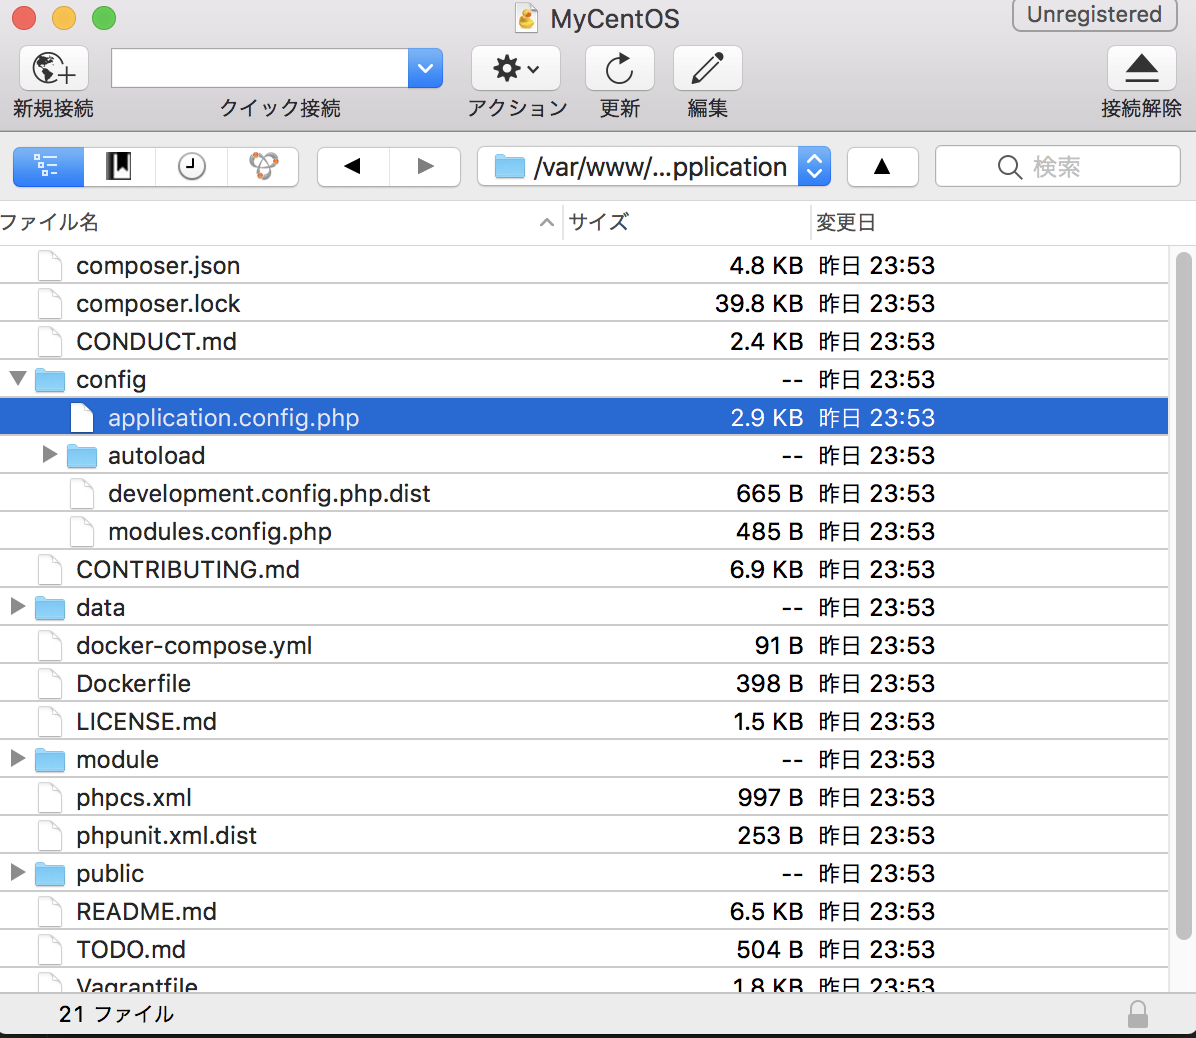
'module_paths' => [
           dirname(__FILE__) . '/../module',
           dirname(__FILE__) . '/../vendor',
        ],
こうじゃないのか?