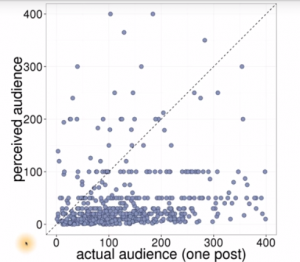
Scatterplots

'''(r)
library(ggplot2)
pf <- read.csv('pseudo_facebook.tsv', sep = '\t')

qplot(x = age, y = friend_count, data = pf)
qplot(age, friend_count, data = pf)
'''
'''(r)
qplot(x = age, y = friend_count, data = pf)

ggplot(aes(x = age, y= friend_count), data = pf) + geom_point()

summary(pf$age)
'''
'''(r)
ggplot(aes(x = age, y = friend_count),data = pf)+
	geom_point(alpha = 1/20) + xlim(13, 90)
'''
