
<script src="https://cdnjs.cloudflare.com/ajax/libs/Chart.js/2.5.0/Chart.bundle.min.js"></script>
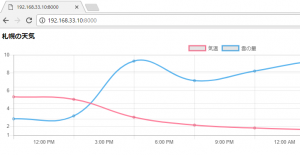
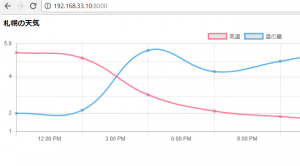
<b>札幌の天気</b>
<canvas id="graph-area" height="250px" width=""></canvas>
<script type="text/javascript">
var ctx = document.getElementById('graph-area').getContext('2d');
var complexChartOption = {
responsive: true,
scales: {
yAxes: [{
id: "y-axis-1",
type: "linear",
position: "left",
ticks: {
max: 10.0,
min: 1.0,
stepSize: 2.0
},
}, {
id: "y-axis-2",
type: "linear",
position: "right",
ticks: {
max: 100,
min: 0,
stepSize: 20
},
}],
}
};
var myChart = new Chart(ctx, {
type: 'bar',
options: complexChartOption,
data: {
labels: ['12:00 PM', '3:00 PM', '6:00 PM', '9:00 PM', '12:00 AM', '3:00 AM', '6:00 AM'],
datasets: [{
type: 'line',
label: '気温',
data: [5.3, 5, 3, 2.1, 1.8, 1.6, 1.6, 2.3],
borderColor : "rgba(254,97,132,0.8)",
yAxisID: "y-axis-1",
fill: false
}, {
type: 'line',
label: '雲の量',
data: [20, 24, 92, 68, 80, 92, 92, 92],
borderColor : "rgba(54,164,235,0.8)",
yAxisID: "y-axis-2",
fill: false
}]
}
});
</script>
問題ありません。
後は配列からjsにデータを渡すところですね。
気温のtickは max(気温の配列)+0.5°Cにしてみます。
$forecast = array('12:00 PM', '3:00 PM', '6:00 PM', '9:00 PM', '12:00 AM', '3:00 AM', '6:00 AM');
$temp = array(5.3, 5, 3, 2.1, 1.8, 1.6, 1.6, 2.3);
$cloud = array(20, 24, 92, 68, 80, 92, 92, 92);

$temp_max = max($temp) + 0.5;
$forecast_list = json_encode($forecast);
$cloud_list = json_encode($cloud);
$temp_list = json_encode($temp);
cakeに入れます。
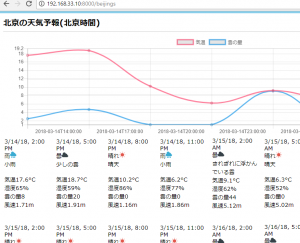
あれ、UIがGoogle Analyticsっぽくなってきた。