php側
1.DBから取得した予約データで、時間は+=,予約数は++で連想配列をつくる
2.array_multisortで時間の多い順に連想配列をソート
3.jsに値を渡す
$i = 0;
while($result = $stmt->fetch(PDO::FETCH_ASSOC)){
	if($year == substr($result['day'], 0, 4) && $month == substr($result['day'], 7, 2)){
		$charge = $result['charge'];
		$book[$charge]['course'] += $result['course'];
		$book[$charge]['count']++;
		$total += $result['course'];
		$i++;
	}
}

foreach($book as $key => $value){
	$time[$key]["course"] = $value["course"];
}
array_multisort($time, SORT_DESC, $book);

foreach($book as $key => $value){
	$name_list[] = $key;
	$time_list[] = $value["course"];
	$count_list[] = $value["count"];
}
chart.js
オプションで、左右の軸を指定する
tickのmaxは配列の中の最も大きい数 x N とする
Math.max.apply(null, array)*N
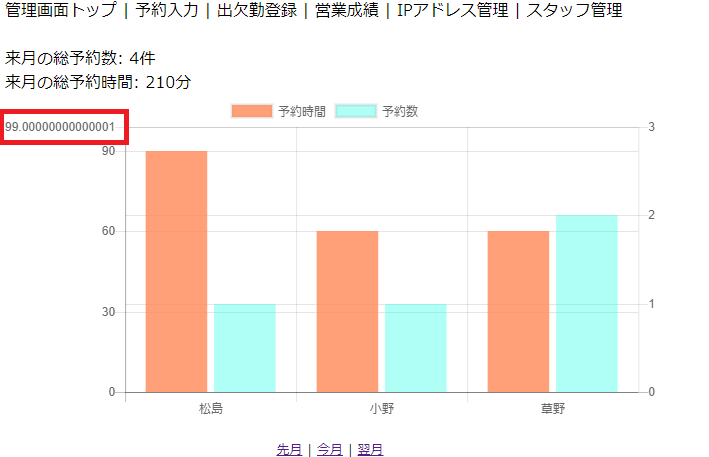
ただし、javascriptの IEEE 754の計算だと、誤差が生じることがある
例 Math.max.apply(null, array)*1.1 = 90.00000000000001(!?)
IEEE 754は、2進法計算だかららしい。※wikipediaを読んだが、何故二進法だと誤差が出るのかは私の頭では理解不能

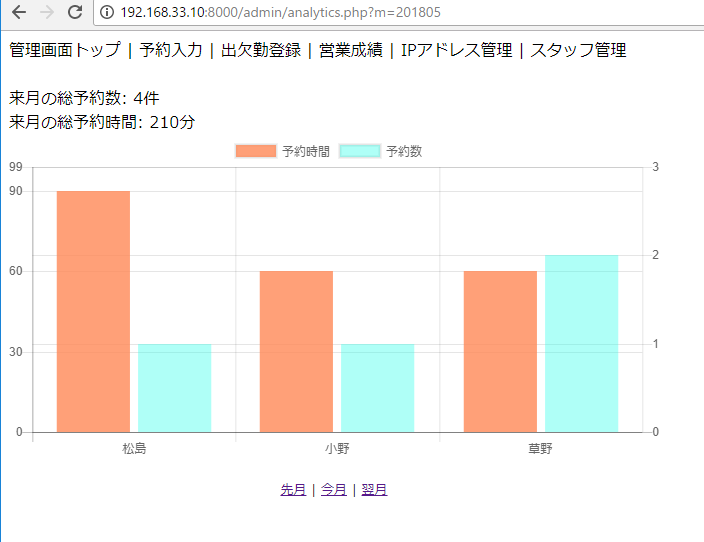
そのため、 Math.floor(Math.max.apply(null, array)*N) として、小数点以下切り捨て
var name_arr = JSON.parse('<?php echo $name_l; ?>');
var time_arr = JSON.parse('<?php echo $time_l; ?>');
var count_arr = JSON.parse('<?php echo $count_l; ?>');
var ctx = document.getElementById("BarChart");
var BarChart = new Chart(ctx, {
	type: 'bar',
	data:{
		labels:name_arr,
		datasets:[{
			label:'予約時間',
			data: time_arr,
			backgroundColor: "rgba(255,136,86,0.8)",
			yAxisID: "y-axis-1",
		},{
			label:'予約数',
			data: count_arr,
			backgroundColor: "rgba(54,264,235,0.4)",
			yAxisID: "y-axis-2",
		}]
		},
		options:{
			responsive: true,
			scales:{
				yAxes:[{
					id: "y-axis-1",
					type: "linear",
					position: "left",
					ticks:{
						max: Math.floor(Math.max.apply(null, time_arr)*1.1),
						min:0,
						stepSize: 30
					}
				},{
					id: "y-axis-2",
					type: "linear",
					position: "right",
					ticks:{
						max: Math.max.apply(null, count_arr)+1,
						min:0,
						stepSize: 1
					}
				}],

			}
		}

});
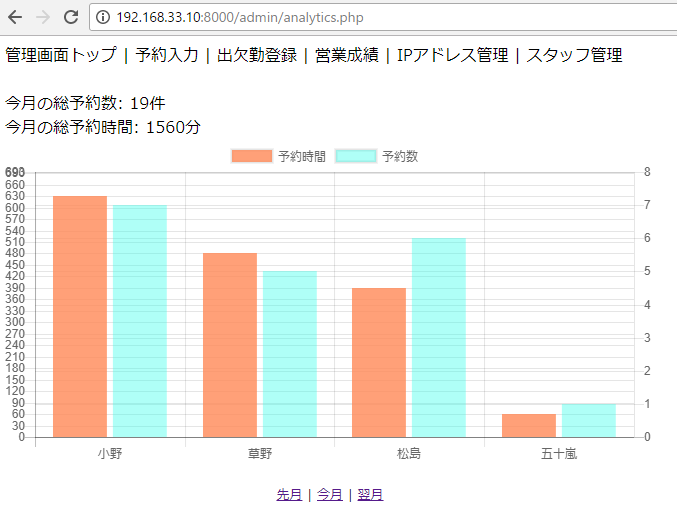
結果:今月

翌月

