Elasticsearchとは

Highly scalable full-text search engine developed by Elastic
Enables various analysis such as real time data analysis, log analysis, full text search
Often used with log aggregation Logstash and fluentd, and visualization tools kibana
Searching across multiple databases is provided as a common use

Elasticsearch
– Strong search performance and scalability
– Indexes are often separated by time intervals
– Throw away indexes that are no longer needed
– Store data for analysis and search

RDS:Elasticsearch
DB -> index
table -> mapping type
column -> field
record -> document

Mapping: Setting of field type and analysis method
Analysis: About processing of field values such as language processing and normalization
Query DSL: Assembling search condition in JSON format

sample

{code}
echo -e ‘logstash\nfluentd\nflume’ | bin/logstash -e ‘input { stdin {} } output { stdout {codec => rubydebug}}’
{
“message” => ‘logstash’,
“@version” => “1”,
“@timestamp” => “2015-01-17T16:18:46.175Z”,
“host” => “hope”
}
{
“message” => “fluentd”,
“@version” => “1”,
“@timestamp” => “2015-01-17T16:18:46.175Z”,
“host” => “hope”
}
{
“message” => “flume”,
“@version” => “1”,
“@timestamp” => “2015-01-17T16:18:46.175Z”,
“host” => “hope”
}
{/code}

{code}
input {
stdin{}
}
filter {
mutate {
replace => {message => “%{message} こんにちは!”}
}
}
output {
stdout {
codec => rubydebug
}
}
{/code}

edit /etc/yum.repos.d directory

yum is an integrated management system for packages.

It manages RPM packages and is more convenient and easier to use than using the rpm command. yum manages and integrates RPM information and resolves dependencies automatically. It is in the same standing position as APT in Debian. By using yum, can update package of distribution, search for package, delete package, display package information, etc.

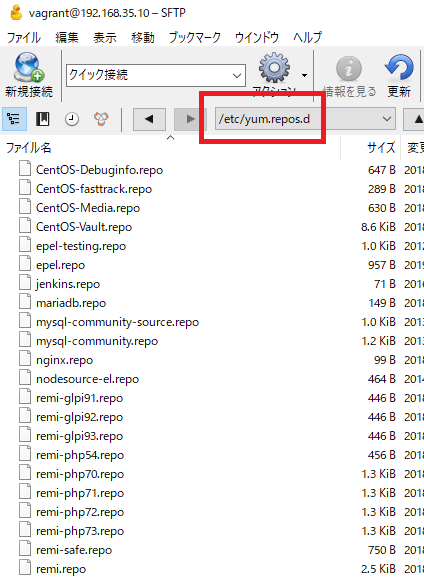
For the repository, a separate file is prepared and describe in “/etc/yum.repos.d”.

[vagrant@localhost ~]$ cd /etc/yum.repos.d
[vagrant@localhost yum.repos.d]$ ls
CentOS-Base.repo mariadb.repo remi-php54.repo
CentOS-Debuginfo.repo mysql-community-source.repo remi-php70.repo
CentOS-Media.repo mysql-community.repo remi-php71.repo
CentOS-Vault.repo nginx.repo remi-php72.repo
CentOS-fasttrack.repo nodesource-el.repo remi-php73.repo
epel-testing.repo remi-glpi91.repo remi-safe.repo
epel.repo remi-glpi92.repo remi.repo
jenkins.repo remi-glpi93.repo
[vagrant@localhost yum.repos.d]$ sudo touch logstash.repo

公式と同じように書きます。
[vagrant@localhost yum.repos.d]$ sudo vi logstash.repo
[vagrant@localhost yum.repos.d]$ cat logstash.repo
[logstash-5.x]
name=Elastic repository for 5.x packages
baseurl=https://artifacts.elastic.co/packages/5.x/yum
gpgcheck=1
gpgkey=https://artifacts.elastic.co/GPG-KEY-elasticsearch
enabled=1
autorefresh=1
type=rpm-md

[vagrant@localhost ~]$ sudo yum install logstash
読み込んだプラグイン:fastestmirror
インストール処理の設定をしています
Loading mirror speeds from cached hostfile
* base: ftp.nara.wide.ad.jp
* extras: ftp.nara.wide.ad.jp
* remi-safe: ftp.riken.jp
* updates: ftp.nara.wide.ad.jp
https://artifacts.elastic.co/packages/5.x/yum/repodata/repomd.xml: [Errno 14] PYCURL ERROR 6 – “Couldn’t resolve host ‘artifacts.elastic.co'”
他のミラーを試します。
エラー: Cannot retrieve repository metadata (repomd.xml) for repository: logstash-5.x. Please verify its path and try again

なにいいいいいいいいいいいいいいいいいいいいい
artifacts.elastic.coが違うだと。。。

REDHATの公式を見る
>Satellite または Proxy サーバーに完全修飾ドメイン名 (FQDN) が設定されており、Apache が使用する SSL 証明書の CommonName (CN) が FQDN に設定されていることを確認してください。

https://access.redhat.com/ja/solutions/1307833

[vagrant@localhost yum.repos.d]$ grep CN /etc/httpd/conf/ssl.crt/server.crt
grep: /etc/httpd/conf/ssl.crt/server.crt: そのようなファイルやディレクトリはありません
[vagrant@localhost yum.repos.d]$ grep ^SSLCert /etc/httpd/conf.d/ssl.conf
SSLCertificateFile /etc/pki/tls/certs/localhost.crt
SSLCertificateKeyFile /etc/pki/tls/private/localhost.key

何言いいいいいいいいいいいいいいいい、わからん。
あかん、とりあえずelasticsearchに行こう。

じゃんがらたべたら

あ、ちゃんと書いてあるやんけ
installing-logstash.html
Add the following in your /etc/yum.repos.d/ directory in a file with a .repo suffix, for example logstash.repo

[logstash-5.x]
name=Elastic repository for 5.x packages
baseurl=https://artifacts.elastic.co/packages/5.x/yum
gpgcheck=1
gpgkey=https://artifacts.elastic.co/GPG-KEY-elasticsearch
enabled=1
autorefresh=1
type=rpm-md

あれ、/etc/yum.repos.d/ って、そもそも何だっけ?

拡張子が.repoですな。centOS, eple, mariadb, mysql-cocommunity, nginxなどありますね。

試しに、jenkins.repoを見てみましょう。

[jenkins]
name=Jenkins
baseurl=http://pkg.jenkins.io/redhat
gpgcheck=1

なるほどー baseurlを指定して、ここからインストールしてるのかな。
yum instrallとRPMについて、少し理解が深まりました^^

set up logstash

Logstashはjava8のインストールが必要らしい

[vagrant@localhost ~]$ java -version
openjdk version “1.8.0_191”
OpenJDK Runtime Environment (build 1.8.0_191-b12)
OpenJDK 64-Bit Server VM (build 25.191-b12, mixed mode)
OK

[vagrant@localhost ~]$ sudo rpm –import https://artifacts.elastic.co/GPG-KEY-elasticsearch
[vagrant@localhost ~]$ sudo yum install logstash
読み込んだプラグイン:fastestmirror
インストール処理の設定をしています
Determining fastest mirrors
* base: ftp.nara.wide.ad.jp
* extras: ftp.nara.wide.ad.jp
* remi-safe: ftp.riken.jp
* updates: ftp.nara.wide.ad.jp
base | 3.7 kB 00:00
extras | 3.4 kB 00:00
jenkins | 2.9 kB 00:00
jenkins/primary_db | 127 kB 00:01
mariadb | 2.9 kB 00:00
mysql-connectors-community | 2.5 kB 00:00
mysql-connectors-community/primary_db | 36 kB 00:00
mysql-tools-community | 2.5 kB 00:00
mysql-tools-community/primary_db | 49 kB 00:00
mysql56-community | 2.5 kB 00:00
mysql56-community/primary_db | 261 kB 00:00
nginx | 2.9 kB 00:00
nginx/primary_db | 49 kB 00:00
nodesource | 2.5 kB 00:00
remi-safe | 3.0 kB 00:00
remi-safe/primary_db | 1.2 MB 00:00
updates | 3.4 kB 00:00
updates/primary_db | 3.7 MB 00:04
パッケージ logstash は利用できません。
エラー: 何もしません

なにいいいいいいいいいいいいいいいいいいい
なぜだああああああああああああああああああああああああああああああああ
もうヤダ。気分転換に日本橋のアンテナショップ行こ。

Logstashを学ぼう

Input
While data is distributed across many systems in different formats, Logstash is a variety of input plug-ins that capture events from different sources simultaneously. You can easily, continuously and smoothly implement data injection from logs, metrics, webapplications, data stores, or various cloud services.

Filter ここは重要か?
Data analysis and transformation
As data is transferred from source to store, Logstash’s filter parses each event and identifies and structures the fields. It further transforms the data into a common format that is best for analysis that delivers business value.

– Extract structures from unstructured data using grok filters
– Get geographical information from IP address
– Anonymize personal information and completely exclude confidential information fields
– Easy processs data from any source, format or schema.
あ、なんかこれは凄そうだ。。

Output
Choose a storage location, and transfer data.
The ideal destination is Elasticsearch, but other destinations are of course also available. The search and analysis possibilities are not impeded.

Logstash allows you to specify various output destinations and transfer data freely. This high degree of flexibility allows you to work with many downstreams.

うん、サンプルをいじりたくなってきました。OKOK!

NetFlow

NetFlow is a technology developed by Cisco Systems, Inc for monitoring and analyzing network traffic information. Implemented primarily in Cisco routers and switches, it is now becoming the industry standard in flow measurement and is now supported by many vendors’ network devices. Analyze flow information such as NetFlow to identify operational or security issues, strengthen external or internal network security.

What is flow in network traffic analysis is like a packet group with common attributes flowing on the network. For example, attributes such as source / destination IP address, source / destination port number, protocol number.
If common, the packet is considered as the same flow. In an easy-to-understand example, if a user uploads a file to the server, the processing in that case is regarded as one flow(in terms of packets, it is a block of multiple packets wit common attributes). By analyzing this flow information, it is possible to monitor and analyze traffic on a per-suer or per-application basis.

JDBC

JDBCって何? MySQL接続する為のドライバだった記憶があるが。。

JDBC is, in word, “a standard Java API for accessing relational dattabases (and almost any tabular data). JDBC is said to be short for “Java Database Connectivity” but it is not actually specified in the JDBC specification.

Critical data in an enterprise is often stored in a relational database. As such, JDBC is one of the key APIs underlying Java-based enterprise applications.

Portable database applications can be built by using JDBC drives that absorb differences between databases and JDBC APIs that are standard APIs that do not depend on specific vendors. Not only for the platform of the execution environment, but also for the connected database, it is possible to realize WORA(Write Once, Run Anywhere), which is one of the outstanding features of Java, at a higher level.

JDBC can be used from various Java components such as:
– Regular Java classes and JavaBeans
– Java application that runs on the client
– Java Applet that runs on a web client(web browser)
– Servlets and JSPs that run on a web container(J2EE server)
– Session Bean or Entity Bean that runs on EJB container(J2EE server)

ああああああああ、Javaでアプリケーション作らないといけない、という課題が露呈してしまった。あかん。

ELK(Elasticsearch, Kibana, Logstash)

ELKって何?持田香織? それELT😭
ELKはElasticsearch、 Logstash、Kibanaの頭文字で、ELK

あれ、ElasticsearchはConsoleにあるけど、LogstashはConsoleにないぞ。どういうことだ??

あら、LogstashはAWSのサービスではないのね。elasticというサービスの中の一つだ。む、これはなんか、機械学習と近い領域か。。

こちの図が関係性をよく表しています。
https://www.elastic.co/jp/products/logstash

わかったけど、ちょっと待て。Apacheは普通にわかるけど、JDBC、Netflowって何?

The four main methods used on the app’s introductory screen

Splash
It is a technique called splash that is adopted by most applications. This screen appears when you tap the app icon from home, and it is used to earn data loading time or to make the app known to the user as a brand.

However, since it is only for the purpose of earning time and recognizing the brand, it is not compatible with tool-based apps. The user who uses the tool wants to “use it quickly and repeatedly”.

Walk through
A technique called walk-through is a method that allows the user to gradually understand the features and usage of the app using slides instead of letting the app touch the app immediately after launching the app. Often see people who call it “Tutorial”, but the official name for this is Walkthrough.

Coach mark
Overlays and pop-ups appear on the normal screen of the app. Use arrows to explain the function of each button and what its contents mean. If the UI becomes complicated and it is determined that “a user who has just installed the app will be confused if you look at this screen”, you should adop it.

Empty state
It may be an unfamiliar word, but the point is “the guy who displays when the content is empty”. The purpose of this screen is “convey information that there is no content now” and “convey action to be performed next”.
It may be more user-friendly to have an empty state for apps that do not display content if you do not follow someone, or for apps such as Notepad that create content yourself.