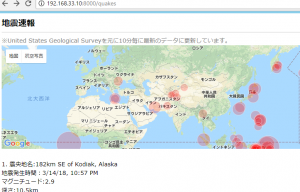
震度に応じて、google mapのアイコン表示を変える

DBから呼び出したmagnitudeの強弱に応じて、markerのiconをgetCircle関数で呼び込んで変えます。

var map;
var infoWindow = [];
var marker = [];

var place = JSON.parse('<?php echo $place_list; ?>');
var mag = JSON.parse('<?php echo $mag_list; ?>');
var lat = JSON.parse('<?php echo $lat_list; ?>');
var lng = JSON.parse('<?php echo $lng_list; ?>');

function initMap() {
    var mapLatLng = new google.maps.LatLng({lat: 35.681167, lng: 139.767052}); 
    map = new google.maps.Map(document.getElementById('map'), { 
     center: mapLatLng, 
      zoom: 2
   });

	 for (var i = 0; i < lat.length; i++) {
	        markerLatLng = new google.maps.LatLng({lat: lat&#91;i&#93;, lng: lng&#91;i&#93;});
	        marker&#91;i&#93; = new google.maps.Marker({ 
	         position: markerLatLng, 
	            map: map,
	            icon: getCircle(mag&#91;i&#93;)
	       });
	 
	     infoWindow&#91;i&#93; = new google.maps.InfoWindow({ 
	         content: '<div class="map">' + place[i] + ' マグニチュード:' + mag[i] + '</div>' 
	       });
	     
	     markerEvent(i);
	 }

	 function getCircle(magnitude) {
        return {
          path: google.maps.SymbolPath.CIRCLE,
          fillColor: 'red',
          fillOpacity: .2,
          scale: Math.pow(2, magnitude) / 2,
          strokeColor: 'white',
          strokeWeight: .5
        };
      }
	 
	function markerEvent(i) {
	    marker[i].addListener('click', function() {
	      infoWindow[i].open(map, marker[i]);
	  });
	}
 }

おお、改めてこれは感動した。

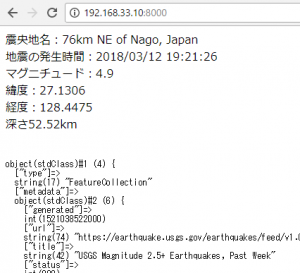
usgsの地震情報をphpで取得

タイムスタンプが何故か桁数が多いので、削除しています。項目は気象庁と合わせます。

$BASE_URL = "https://earthquake.usgs.gov/earthquakes/feed/v1.0/summary/2.5_week.geojson";
$obj = json_decode(file_get_contents($BASE_URL));

echo "震央地名:" .$obj->features[65]->properties->place ."<br>";
$date = $obj->features[65]->properties->time;
$date = substr($date, 0, -3);
echo "地震の発生時間:" .date("Y/m/d H:i:s", $date) ."<br>";
echo "マグニチュード:" .$obj->features[65]->properties->mag ."<br>";
echo "緯度:" .$obj->features[65]->geometry->coordinates[1] ."<br>";
echo "経度:" .$obj->features[65]->geometry->coordinates[0] ."<br>";
echo "深さ:" .$obj->features[65]->geometry->coordinates[2] ."km<br>";

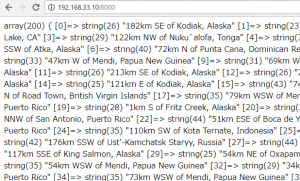
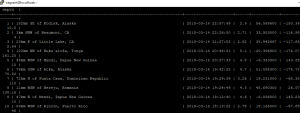
問題なさそうなので、最新200を配列に入れます。

$BASE_URL = "https://earthquake.usgs.gov/earthquakes/feed/v1.0/summary/2.5_week.geojson";
$obj = json_decode(file_get_contents($BASE_URL));

for($i=0; $i<200; $i++){
	$place&#91;&#93; = $obj->features[$i]->properties->place;
	$date = $obj->features[$i]->properties->time;
	$date = substr($date, 0, -3);
	$time[] = date("Y/m/d H:i:s", $date);
	$mag[] = $obj->features[$i]->properties->mag;
	$lon[] =$obj->features[$i]->geometry->coordinates[1];
	$lat[] = $obj->features[$i]->geometry->coordinates[0];
	$depth = $obj->features[$i]->geometry->coordinates[2];
}

テーブルをつくります。

create table weather.quakes(
	id int unsigned auto_increment primary key,
	place varchar(255),
	time datetime unique,
	mag float,
	lat double(8,6),
	lng double(9,6),
	depth float
);

入りました。

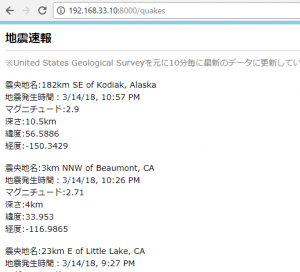
index.ctpをつくってあげます。

<?php
	$this->assign('title', '地震速報');
?>
<?= $this->element('menu'); ?>
<h1>地震速報</h1>
<span style="color:gray">※United States Geological Surveyを元に10分毎に最新のデータに更新しています。</span><br><br>

	<?php 
	$i = 1;
	foreach ($quakes as $quake){
	echo "震央地名:" .h($quake->place)."<br>";
	echo "地震発生時間:" .($quake->time)."<br>";
	echo "マグニチュード:".($quake->mag)."<br>";
	echo "深さ:".($quake->depth)."km<br>";
	echo "緯度:". ($quake->lat)."<br>";
	echo "経度:".($quake->lng)."<br><br>";
	}
	?>

気象庁とUSGSの地震データを比較してみる

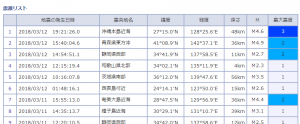
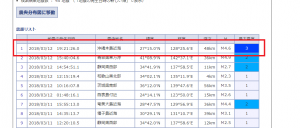
まず気象庁
———–
地震の発生日時 震央地名 緯度 経度 深さ M 最大震度
1 2018/03/12 19:21:26.0 沖縄本島近海 27°15.0′N 128°25.6′E 48km M4.6 3

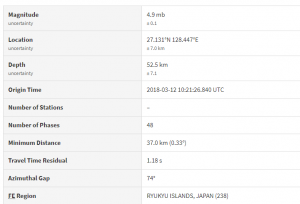
USGS
———-
Magnitude
uncertainty
4.9 mb
± 0.1
Location
uncertainty
27.131°N 128.447°E
± 7.0 km
Depth
uncertainty
52.5 km
± 7.1
Origin Time 2018-03-12 10:21:26.840 UTC
Number of Stations –
Number of Phases 48
Minimum Distance 37.0 km (0.33°)
Travel Time Residual 1.18 s
Azimuthal Gap 74°
FE Region RYUKYU ISLANDS, JAPAN (238)

時間はほぼ一緒ですが、マグニチュード、緯度経度、depth、全て値が微妙に異なります。

マグニチュード:地震が発するエネルギーの大きさを対数で表した指標値
地震のエネルギーを1000の平方根を底とした対数で表した数値で、マグニチュードが 1 増えると地震のエネルギーは約31.6倍になり、マグニチュードが 2 増えると地震のエネルギーは1000倍になる

マグニチュード測定方法:地震計
USGS:GPSや地震計を一定間隔で配備して、ネットワーク化、地下深くまでドリルで穴を開けて分析

気象庁とUSGSでは、どちらのデータが精度が高いのか疑問に思ったのですが、
下記資料をざっと流し読みすると、やってる事にあまり違いがないように感じます。
http://www.spaceref.co.jp/homepage/colum/images/US_earthquake_observation.pdf

ということで、今回は、USGSのデータを使って、地震情報をつくっていきたいと思います。

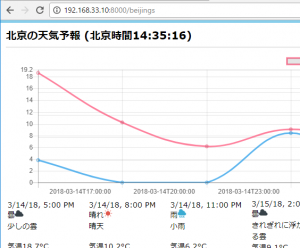
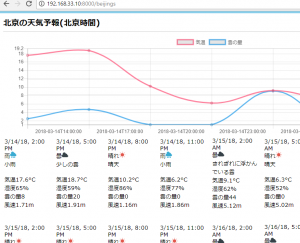
javascriptで北京の標準時間

<b>北京の標準時間</b>
<div id="time"></div>
<script type="text/javascript">
var diff = 1;
var value = diff + 15;
time();
function time(){
  var now = new Date(Date.now() - (value*60 - new Date().getTimezoneOffset())*60000);
  document.getElementById("time").innerHTML = now.toLocaleTimeString();
}
setInterval('time()', 1000);
</script>

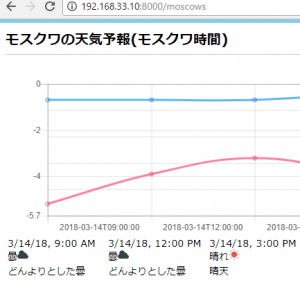
気温が0°C以下の場合は、tickを0以下にする

php側

$temp_max = max($temp) + 0.5;
  if(min($temp) > 0 ){
   $temp_min = 0;
  } else {
   $temp_min = min($temp) - 0.5;
  }

JS側

ticks: {
            max: <?php echo $temp_max; ?>,
            min: <?php echo $temp_min; ?>,
            stepSize: 2.0
          }

最高気温の方も必要でした(モスクワ笑)

if(max($temp) < 0 ){
	 $temp_max = 0;
	} else {
	 $temp_max = max($temp) + 0.5;
	}
	if(min($temp) > 0 ){
	 $temp_min = 0;
	} else {
	 $temp_min = min($temp) - 0.5;
	}

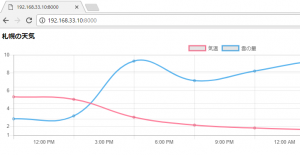
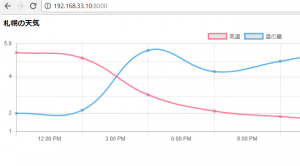
chart.jsの複合チャートで気温と雲の量を表示する

<script src="https://cdnjs.cloudflare.com/ajax/libs/Chart.js/2.5.0/Chart.bundle.min.js"></script>
<b>札幌の天気</b>
<canvas id="graph-area" height="250px" width=""></canvas>
<script type="text/javascript">
    var ctx = document.getElementById('graph-area').getContext('2d');
    var complexChartOption = {
      responsive: true,
      scales: {
        yAxes: [{
          id: "y-axis-1",
          type: "linear", 
          position: "left",
          ticks: {
            max: 10.0,
            min: 1.0,
            stepSize: 2.0
          },
        }, {
          id: "y-axis-2",
          type: "linear", 
          position: "right",
          ticks: {
              max: 100,
              min: 0,
              stepSize: 20
          },
        }],
      }
    };
    var myChart = new Chart(ctx, {
      type: 'bar',
      options: complexChartOption,
      data: {
        labels: ['12:00 PM', '3:00 PM', '6:00 PM', '9:00 PM', '12:00 AM', '3:00 AM', '6:00 AM'],
        datasets: [{
          type: 'line',
          label: '気温',
          data: [5.3, 5, 3, 2.1, 1.8, 1.6, 1.6, 2.3],
          borderColor : "rgba(254,97,132,0.8)",
          yAxisID: "y-axis-1",
          fill: false
        }, {
          type: 'line',
          label: '雲の量',
          data: [20, 24, 92, 68, 80, 92, 92, 92],
          borderColor : "rgba(54,164,235,0.8)",
          yAxisID: "y-axis-2",
          fill: false
        }]
      }
    });
</script>

問題ありません。

後は配列からjsにデータを渡すところですね。
気温のtickは max(気温の配列)+0.5°Cにしてみます。

$forecast = array('12:00 PM', '3:00 PM', '6:00 PM', '9:00 PM', '12:00 AM', '3:00 AM', '6:00 AM');
$temp = array(5.3, 5, 3, 2.1, 1.8, 1.6, 1.6, 2.3);
$cloud = array(20, 24, 92, 68, 80, 92, 92, 92);

$temp_max = max($temp) + 0.5;
$forecast_list = json_encode($forecast); 
$cloud_list = json_encode($cloud); 
$temp_list = json_encode($temp); 

cakeに入れます。

あれ、UIがGoogle Analyticsっぽくなってきた。

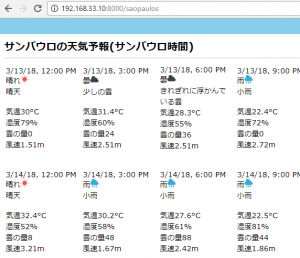
各都市のviewをつくっていく

index.ctp

<?php
	$this->assign('title', 'サンパウロの天気予報');
?>
<?= $this->element('module'); ?>

<h1>サンパウロの天気予報(サンパウロ時間)</h1>

<table class="table1">
	<tr>
	<?php 
	$i = 1;
	foreach ($saopaulos as $saopaulo){
	echo "<td width=\"150px\">";
	echo h($saopaulo->forecast)."<br>";
	$date = h($saopaulo->forecast);
	$result = substr($date, -8);
	if($result == ' 9:00 PM' or $result == '12:00 AM' or $result == ' 3:00 AM'){
	echo convert3(($saopaulo->main))."<br>";
	} else {
	echo convert(($saopaulo->main))."<br>";
	}
	echo convert2(($saopaulo->description))."<br>";
	echo "気温".h($saopaulo->temp)."°C<br>";
	echo "湿度". h($saopaulo->humidity)."%<br>";
	echo "雲の量".h($saopaulo->cloud)."<br>";
	echo "風速".h($saopaulo->speed)."m<br>";
	echo "<td>";
	if($i % 8 == 0){
	echo "</tr><tr>";
	}
	$i++;
	}
	?>
	</tr>
</table>

サンパウロ暑いですね!

controller、indexctp、lon・latを整える

DBの用意が出来たので、controllerから作っていきます。mysqlからselectする際に時差を計算してあげます。
WorldwidesController.php

<?php

namespace App\Controller;

use Cake\ORM\TableRegistry;  

class WorldwidesController extends AppController
{	
	public function initialize()
    {
         parent::initialize();
         $this->Londons = TableRegistry::get('londons');
         $this->Moscows = TableRegistry::get('moscows');
         $this->Cairos = TableRegistry::get('cairos');
         $this->Capetowns = TableRegistry::get('capetowns');
         $this->Beijings = TableRegistry::get('beijings');
         $this->Jakartas = TableRegistry::get('jakartas');
         $this->Marunouchis = TableRegistry::get('marunouchis');
         $this->Sydneys = TableRegistry::get('sydneys');
         $this->Losangeles = TableRegistry::get('losangeles');
         $this->Newyorks = TableRegistry::get('newyorks');
         $this->Limas = TableRegistry::get('limas');
         $this->Saopaulos = TableRegistry::get('saopaulos');
    }

	public function index()
	{
		$this->viewBuilder()->layout('my_layout');
		$now1 = date("Y-m-d H:i:s", strtotime(date(DATE_RFC2822) . '-9hour'));
		$param1 = array(
		    'conditions' => array(
		        'forecast >' => $now1, 
		    ),
		);
		$londons = $this->Londons->find('all', $param1)->limit(8);
		$now2 = date("Y-m-d H:i:s", strtotime(date(DATE_RFC2822) . '-6hour'));
		$param2 = array(
		    'conditions' => array(
		        'forecast >' => $now2, 
		    ),
		);
		$moscows = $this->Moscows->find('all', $param2)->limit(8);
		$now3 = date("Y-m-d H:i:s", strtotime(date(DATE_RFC2822) . '-8hour'));
		$param3 = array(
		    'conditions' => array(
		        'forecast >' => $now3, 
		    ),
		);
		$cairos = $this->Cairos->find('all', $param3)->limit(8);
		$capetowns = $this->Capetowns->find('all', $param3)->limit(8);
		$now4 = date("Y-m-d H:i:s", strtotime(date(DATE_RFC2822) . '-1hour'));
		$param4 = array(
		    'conditions' => array(
		        'forecast >' => $now4, 
		    ),
		);
		$beijings = $this->Beijings->find('all', $param4)->limit(8);
		$now5 = date("Y-m-d H:i:s");
		$param5 = array(
		    'conditions' => array(
		        'forecast >' => $now5, 
		    ),
		);
		$marunouchis = $this->Marunouchis->find('all', $param5)->limit(8);
		$now6 = date("Y-m-d H:i:s", strtotime(date(DATE_RFC2822) . '-2hour'));
		$param6 = array(
		    'conditions' => array(
		        'forecast >' => $now6, 
		    ),
		);
		$jakartas = $this->Jakartas->find('all', $param6)->limit(8);
		$now7 = date("Y-m-d H:i:s", strtotime(date(DATE_RFC2822) . '+3hour'));
		$param7 = array(
		    'conditions' => array(
		        'forecast >' => $now7, 
		    ),
		);
		$sydneys = $this->Sydneys->find('all', $param7)->limit(8);
		$now8 = date("Y-m-d H:i:s", strtotime(date(DATE_RFC2822) . '-16hour'));
		$param8 = array(
		    'conditions' => array(
		        'forecast >' => $now8, 
		    ),
		);
		$losangeles = $this->Losangeles->find('all', $param8)->limit(8);
		$now9 = date("Y-m-d H:i:s", strtotime(date(DATE_RFC2822) . '-13hour'));
		$param9 = array(
		    'conditions' => array(
		        'forecast >' => $now9, 
		    ),
		);
		$newyorks = $this->Newyorks->find('all', $param9)->limit(8);
		$now10 = date("Y-m-d H:i:s", strtotime(date(DATE_RFC2822) . '-14hour'));
		$param10 = array(
		    'conditions' => array(
		        'forecast >' => $now10, 
		    ),
		);
		$limas = $this->Limas->find('all', $param10)->limit(8);
		$now11 = date("Y-m-d H:i:s", strtotime(date(DATE_RFC2822) . '-12hour'));
		$param11 = array(
		    'conditions' => array(
		        'forecast >' => $now11, 
		    ),
		);
		$saopaulos = $this->Saopaulos->find('all', $param11)->limit(8);
		$this->set(compact('londons'));
		$this->set(compact('moscows'));
		$this->set(compact('cairos'));
		$this->set(compact('capetowns'));
		$this->set(compact('beijings'));	
		$this->set(compact('marunouchis'));
		$this->set(compact('jakartas'));
		$this->set(compact('sydneys'));
		$this->set(compact('losangeles'));
		$this->set(compact('newyorks'));
		$this->set(compact('limas'));
		$this->set(compact('saopaulos'));
	}
}
?>

緯度経度を追記します。

var markerData = [ 
  {
       name: 'ロンドン',
       lat: 51.507351,
        lng: -0.127758,
        icon: icon[0]
 }, {
 	name: 'モスクワ',
       lat: 55.755826,
        lng: 37.6173,
        icon: icon[1]
 }, {
 	name: 'カイロ',
       lat: 30.0444196,
        lng: 31.2357116,
        icon: icon[2]
 }, {
 	name: 'ケープタウン',
       lat:  -33.924869,
        lng: 18.424055,
        icon: icon[3]
 }, {
 	name: '北京',
       lat: 39.9042,
        lng: 116.407396,
        icon: icon[4]
 }, {
 	name: '東京',
       lat: 35.681167,
        lng: 139.767052,
        icon: icon[5]
 }, {
        name: 'ジャカルタ',
     	lat:  -6.17511,
        lng: 106.86504,
        icon: icon[6]
 }, {
 	name: 'シドニー',
       lat: -33.86882,
        lng: 151.209296,
        icon: icon[7]
 }, {
 	name: 'ロサンゼルス',
       lat: 34.052234,
        lng: -118.243685,
        icon: icon[8]
 }, {
 	name: 'ニューヨーク',
       lat: 40.712775,
        lng: -74.005973,
        icon: icon[9]
 }, {
 	name: 'リマ',
       lat: -12.046373,
        lng: -77.042754,
        icon: icon[10]
 }, {
 	name: 'サンパウロ',
       lat: -23.55052,
        lng: -46.633309,
        icon: icon[11]
 }
];

思ってたより簡単にできましたね。
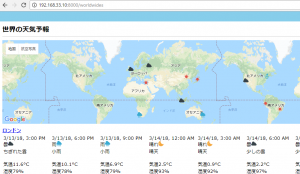
この際、海外の天気予報も作ってしまおう

ということで、幾つか都市をcity.list.jsonからピックアップして、グリニッジ標準時刻との時差をそれぞれ調べます。

City of London GB UTC,
Moscow RU UTC+3,
Cairo EG UTC+2,
Cape Town ZA UTC+2,
Beijing Shi CN UTC+8,
Daerah Khusus Ibukota Jakarta ID UTC+7,
City of Sydney AU UTC+11,
Los Angeles US UTC-7,
New York US UTC-4,
Lima PE UTC-5,
Sao Paulo BR UTC-3

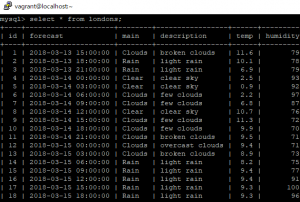
DBのテーブルをくって、データを流し込んでいきます。

london 12時で10°Cくらいなので、あってそうですね。

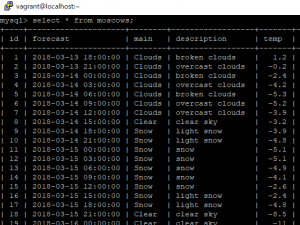
moscow 12時 -3.9°C 笑

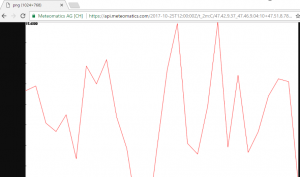
Weather系のAPIはMeteomatics APIがいいらしい

Weather系のAPIはMeteomatics API(https://api.meteomatics.com)がいいらしい、とのことで、gmailでsign upしたところ、

Thanks a lot for your interest in our Weather API. Since the Meteomatics Weather API is a premium product primarily targeted at corporate customers, we would kindly ask you to re-send your request from your employer’s mail account.
We will be happy to provide you with a trial account.

しょうがないので、法人のメールアドレスでsign upしたら、一か月の有効期限とのこと。
Thank you very much for your interest in our weather API!
We have just created a trial account for you:
User: hoge
PW: hogehoge
Valid until 2018-04-14

見えるようになりましたが、1カ月はきついですね。
スイスの会社です。言語がEnglishとGerman。そういえばゼミの教授もスイス人でした。