
正規分布:平均値の周辺にデータが集積するデータ分布
平均が50、対象が1000、標準偏差が10とする
確率密度を狭めていく
import numpy as np
import matplotlib.pyplot as plt

x = np.random.normal(50, 10, 1000)

plt.hist(x, bins=20)
plt.savefig("01")

plt.hist(x, bins=50)
plt.savefig("02")

plt.hist(x, bins=100)
plt.savefig("03")
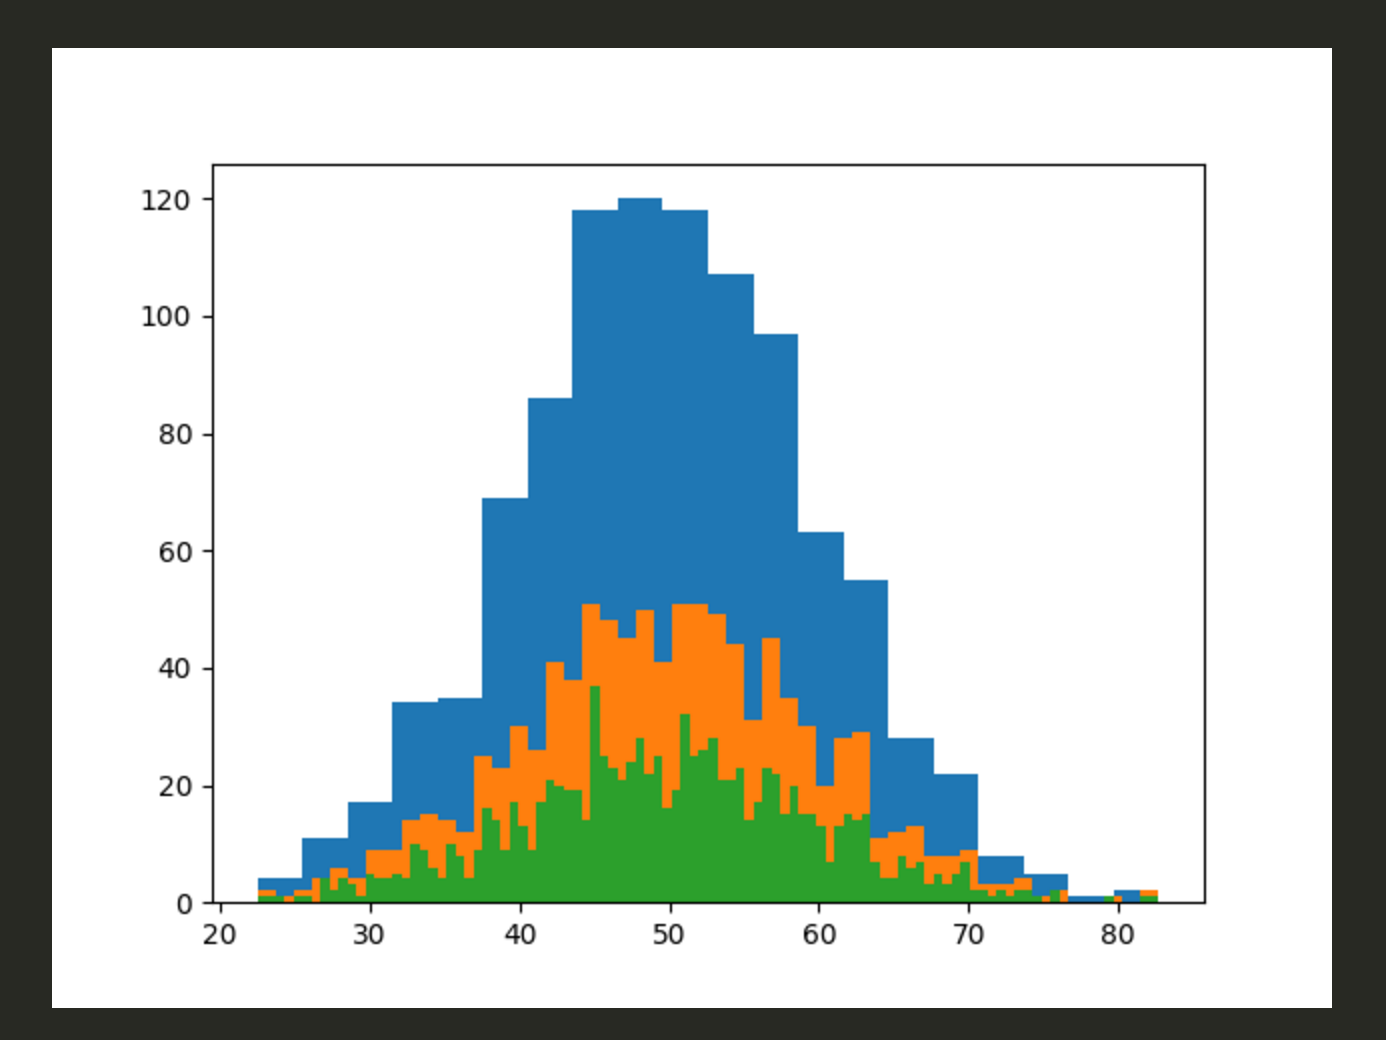
まあ、正常なデータでしょうね。