
まず、仮データでつくる。
<style>
#line {
 height:200;
 width:750;
}
</style>
<script src="https://cdnjs.cloudflare.com/ajax/libs/Chart.js/2.1.4/Chart.min.js"></script>
<div id="line">
<canvas id="myChart" width="750" height="200"></canvas>
</div>
<script>
var ctx = document.getElementById("myChart").getContext('2d');
var myChart = new Chart(ctx, {
   type: 'line',
   data: {
      labels: ["00", "01", "02", "03", "04", "05", "06", "07", "08", "09", "10", "11", "12","13","14","15","16","17","18","19","20","21","22","23","24"],
      datasets: [
      {
         label: "Page View",
         borderColor: 'rgb(0, 153, 255)',
         backgroundColor: "#D9E5FF",
         lineTension: 0,
         data: [20, 26, 12, 43, 33, 21, 29, 5, 5, 0, 1,2,2, 3, 4, 5, 5, 5,6, 7, 22, 23, 15, 100, 24],
      },
      ]
   },
   options: {
      responsive: true,
      scales: {
        yAxes: [{
        	ticks: {
            max: 110,
          }
        }]
      }
   }
});
</script>
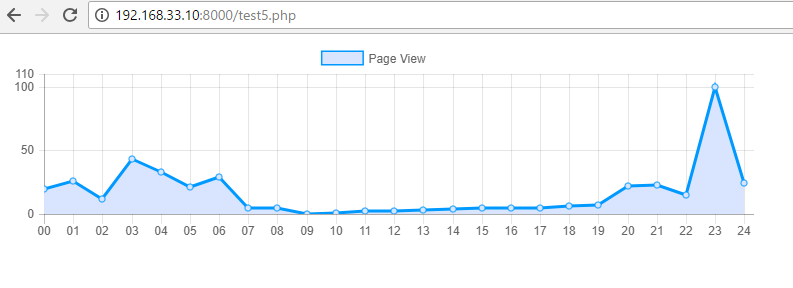
データラベルが00~24なので、countしたいが、どう組めば一番早い?