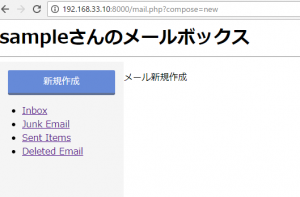
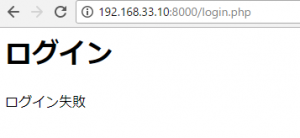
<div class="flex-2"> <?php if($_GET["compose"] == 'new'): ?> <form action="" method="post"> 宛先:<br> <span id="fs-s">※送り先のユーザ名を入力してください</span> <input type="text" name="to" size="90%"><br> 件名:<br> <input type="text" name="subject" size="90%"><br> 本文:<br> <textarea name="body" rows="12" cols="100%"></textarea> </p> <p> <input type="submit" value="送信"> </form> <?php endif; ?> </div>
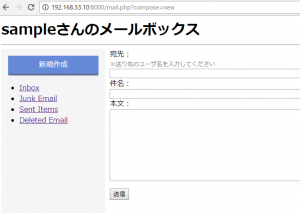
宛先と本文を必須(required)にする
<?php if($_GET["compose"] == 'new'): ?> <form action="" method="post"> 宛先 <span id="fs-s">※必須</span><br> <input type="text" name="to" size="90%" required><br> 件名<br> <input type="text" name="subject" size="90%"><br> 本文 <span id="fs-s">※必須</span><br> <textarea name="body" rows="12" cols="100%" required></textarea> </p> <p> <input type="submit" value="送信"> </form> <?php endif; ?>
DBに入れるため、postの内容を受け取り、変数に格納する
session_start();
if(isset($_POST["to"])){
	$to = $_POST["to"];
	$subject = $_POST["subject"];
	$body = $_POST["body"];
}
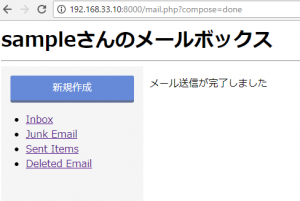
送信後はパラメータを”?compose=done”に変更する
<?php if($_GET["compose"] == 'new'): ?> <form action="?compose=done" method="post"> 宛先 <span id="fs-s">※必須</span><br> <input type="text" name="to" size="90%" required><br> 件名<br> <input type="text" name="subject" size="90%"><br> 本文 <span id="fs-s">※必須</span><br> <textarea name="body" rows="12" cols="100%" required></textarea> </p> <p> <input type="submit" value="送信"> </form> <?php elseif($_GET["compose"] == 'done'): ?> <p>メール送信が完了しました</p> <?php endif; ?>
おお、なんか凄い疲れた。