[AWS CloudFormation] cloudwatchによるautorecovery

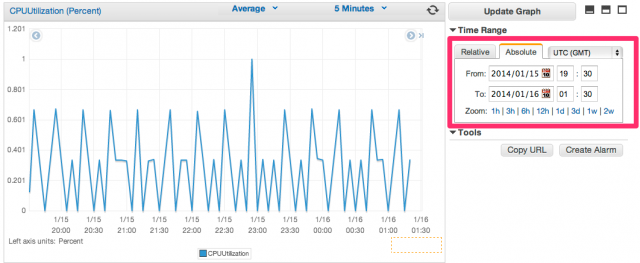
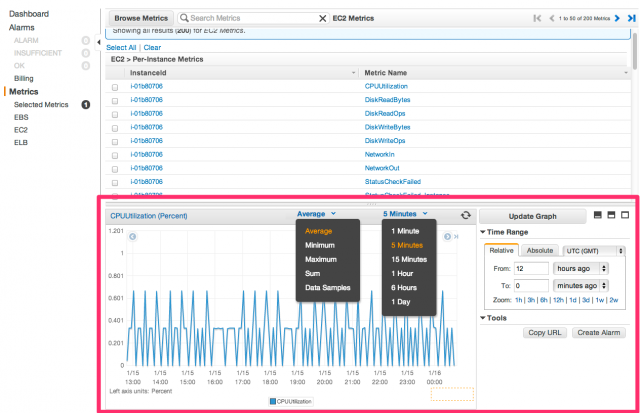
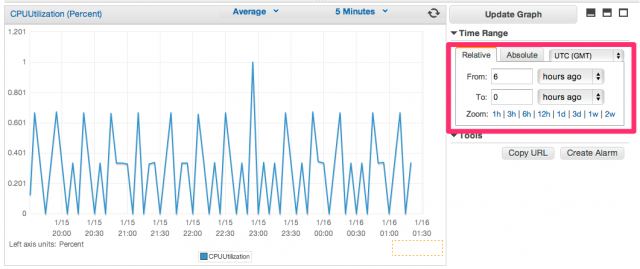
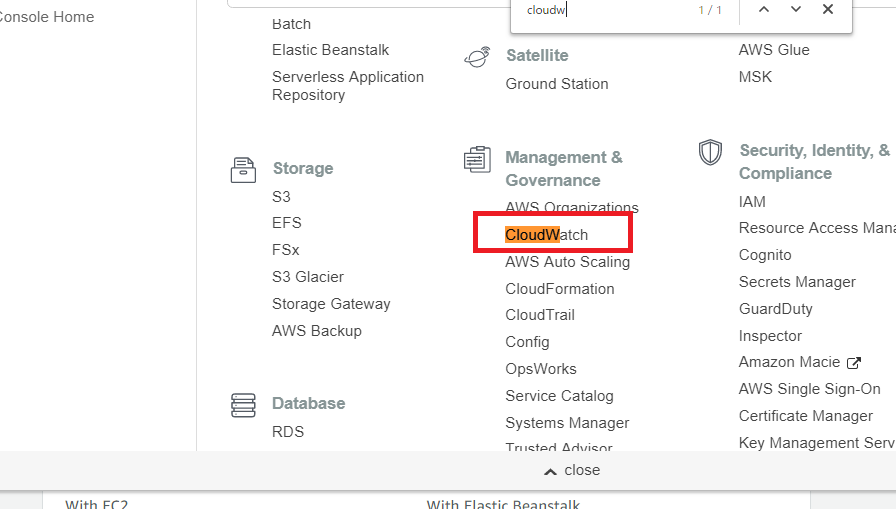
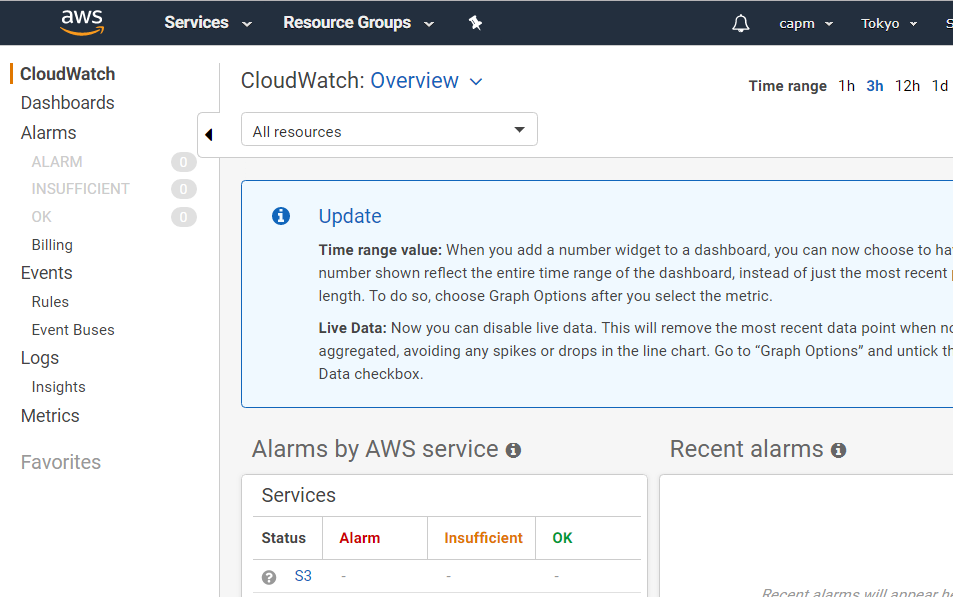
EC2インスタンスをCloudWatchでモニタリングし、基になるハードウェア障害またはAWSによる復旧を必要とする問題でインスタンスが正常に機能しなくなった事象を検知すると、CloudWatchが自動的にインスタンスを復旧する

cloudwatch-autorecovery.yml

AWSTemplateFormatVersion: "2010-09-09"
Description:
  Auto Recovery for EC2

# ------------------------------------------------------------#
# Input Parameters
# ------------------------------------------------------------# 
Parameters:
  EC2Instance:
    Type: AWS::EC2::Instance::Id

Resources:
# ------------------------------------------------------------#
#  AutoRecoveryAlarm
# ------------------------------------------------------------# 
  AutoRecoveryAlarm:
    Type: AWS::CloudWatch::Alarm
    Properties:
      AlarmName: !Sub "${EC2Instance}-autorecovery"
      Namespace: AWS/EC2
      MetricName: StatusCheckFailed_System
      Statistic: Minimum
      Period: 60
      EvaluationPeriods: 10
      ComparisonOperator: GreaterThanThreshold
      Threshold: 0
      AlarmActions:
        - !Sub "arn:aws:automate:${AWS::Region}:ec2:recover"
      Dimensions:
        - Name: InstanceId
          Value: !Ref EC2Instance
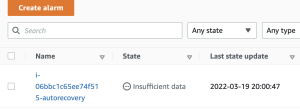
なるほど、これはいけるね

CloudWatch Logsを使いたい

### CloudWatch Logsの主な機能
– インスタンスやサービスログの蓄積
– ログのモニタリング
– ログのフィルタリング
– ログデータのアーカイブ
– ログデータの分析
– ログのアラート化

### IAMロールの作成
AWS Service -> EC2 -> Add Permissionで “CloudWatchLogsFullAccess” をつける -> role nameはそのまま”CloudWatchLogsFullAccess” にする

### roleをattach
Modify IAM roleで作成した”CloudWatchLogsFullAccess”をroleにつける

sshログインしてapache2を入れる
$ sudo yum install httpd
$ sudo systemctl start httpd
$ sudo systemctl status httpd
$ sudo systemctl enable httpd
$ sudo systemctl is-enabled httpd
$ httpd -v

public ipを叩き、ipが入っていることを確認

cloudwatch logsエージェントインストール
$ sudo yum install -y awslogs

/etc/awslogs/awscli.confがconfファイル。us-east-1になっているので、ap-northeast-1に変更する
$ sudo cat /etc/awslogs/awscli.conf

[plugins]
cwlogs = cwlogs
[default]
region = us-east-1
[plugins]
cwlogs = cwlogs
[default]
region = ap-northeast-1

$ sudo cat /etc/awslogs/awslogs.conf

[/var/log/messages]
datetime_format = %b %d %H:%M:%S
file = /var/log/messages
buffer_duration = 5000
log_stream_name = {instance_id}
initial_position = start_of_file
log_group_name = /var/log/messages

fileで対象となるログファイルを指定する
buffer_duration: ログイベントのバッチ期間

apacheエラーログを追加

[Apache_AccessLog]
log_group_name = TestSV_Apache
log_stream_name = {instance_id}_accesslog
file = /etc/httpd/logs/access_log
datetime_format = %a %b %d %H:%M:%S %Y
initial_position = start_of_file
buffer_duration = 5000

[Apache_ErrorLog]
log_group_name = TestSV_Apache
log_stream_name = {instance_id}_errorlog
file = /etc/httpd/logs/error_log
datetime_format = %a %b %d %H:%M:%S %Y
initial_position = start_of_file
buffer_duration = 5000

amazon linux2 amiの場合
$ sudo systemctl start awslogsd

CloudWatch Logsで確認するとログが出力されている

なるほど、これをS3に転送するのね
なんか凄いことになってるな

CloudWatch基本項目

CloudWatch基本事項
– Namespace
– Metrics
– Time stamps
– Dimensions
– Statics
– Alarms

### Namespace
複数のメトリクスをまとめてコンテナ(箱)で管理する概念
異なる名前空間のメトリクスは相互に切り離されている

### Metrics
ある時間ごとのデータポイントのセット
作成されたリージョンのみ存在
メトリクスの保持期間がある

### Time stamps
メトリクスデータポイントの必須情報

### dimension
メトリクスを一意に識別する名前/値のペア

### Statistics
指定した期間のメトリクスデータの集計

### Alarms
指定した期間の単一のメトリクスを監視

### アラームの作成
CloudWatchの画面でアラーム作成

Metrics Name, Image ID, Statistic, Periodを選択

うむ、中々素晴らしいですね。

CloudWatch入門

CloudWatchとは?
-> AWSのリソースやアプリケーション、オンプレミスのサーバをモニタリングするためのマネージドサービス
-> 監視そのももの機能以外にアラーム通知、イベント検知、可視化などの機能がある

### CloudWatchメトリクス
メトリクスとは、システムのパフォーマンスに関するデータ
監視対象のリソースからメトリクスを収集することで監視を行う
CloudWatchメトリクスでは、まず名前空間という単位でグループ化される
その中でディメンション(=名前と値)の組み合わせごとにグループ化される
※統計、期間、ディメンション、標準メトリクス

### CloudWatch Logs
ログファイルの監視と保存を担う機能
AWSサービスやオンプレミスサーバからエージェント経由でログメッセージをCloudWatchエンドポイントに転送することでログデータの保存が出来る。ログデータは保存期間として1日~永久保存を選択できる
ロググループというログのグループ単位があり、その中にログストリームというグループの単位があり、その中にログイベントが保存
Kinesis Data Streams, Kinesis Data Firehose, Lambdaに配信できる
S3に保存するとコストを抑えられる

### CloudWatch Event
AWSリソースの状態が変化した場合にアクションを実行できる

アラームの設定
– 対象のメトリックス
– 統計方法: 平均、最大、合計などの中から適切な統計方法を選択
– 期間: 何分単位に1回メトリクスを評価するのか設定

### CloudWatch Dashboard
複数のログやメトリクスを一つの画面で確認することができる

実際に、CloudWatchメトリクス、CloudWatch Logs, CloudWatch Alarms、CloudWatch Eventを一つずつ使ってみないとわからんな…

[AWS CloudFormation] VPCフローログ -> CloudWatch

CloudWatchとはAWSで提供されているモニタリングサービス
カスタムメトリクスという機能を利用することで、モニタリングを統合できる

– セットアップ不要で使用できる
– 異常な状態を検知して、自動復旧
– メトリクスに応じてアラート通知やアクションを設定できる
– 監視対象はEC2, EBSなど

### CloudWatchのサービス
「CloudWatch」: CPU, メモリなどを監視。メール、再起動、AutoScaleなどできる
「CloudWatch Logs」: 各種ログ
「CloudWatch Events」: APIイベントをトリガーにアクションを実行

AWSTemplateFormatVersion: "2010-09-09"
Description:
  VPCFlowLogs Settings

Metadata:
  "AWS::CloudFormation::Interface":
    ParameterGroups:
      - Label:
          default: "Project Name Prefix"
        Parameters:
          - PJPrefix
      - Label:
          default: "VPCFlowLogs Configuration (Destination Type is CloudWatchLogs)"
        Parameters:
          - Filter
          - RetentionInDays

# ------------------------------------------------------------#
# Input Parameters
# ------------------------------------------------------------# 
Parameters:
  PJPrefix:
    Type: String

  Filter:
    Type: String
    Default: ALL
    AllowedValues: [ ALL, ACCEPT, REJECT ]

  RetentionInDays:
    AllowedValues: [ 1, 3, 5, 7, 14, 30, 60, 90, 120, 150, 180, 365, 400, 545, 731, 1827, 3653 ]
    Type: Number
    Default: 30

Resources:
# ------------------------------------------------------------#
#  IAM Role for VPCFlowLogs
# ------------------------------------------------------------# 
# VPCFlowLogsIAMRole:
  VPCFlowLogsIAMRole:
    Type: "AWS::IAM::Role"
    Properties:
      RoleName: !Sub "${PJPrefix}-vpcflowlogs-role"
      AssumeRolePolicyDocument:
        Version: "2012-10-17"
        Statement:
          - Effect: Allow
            Principal:
              Service:
                - "vpc-flow-logs.amazonaws.com"
            Action:
              - "sts:AssumeRole"

      Policies:
      - PolicyName: !Sub "${PJPrefix}-vpcflowlogs-policy"
        PolicyDocument:
          Version: "2012-10-17"
          Statement:
            - Effect: Allow
              Action:
              - "logs:CreateLogGroup"
              - "logs:CreateLogStream"
              - "logs:PutLogEvents"
              - "logs:DescribeLogGroups"
              - "logs:DescribeLogStreams"
              Resource: "*"

# ------------------------------------------------------------#
#  LogGroup
# ------------------------------------------------------------#
  LogGroup:
    Type: "AWS::Logs::LogGroup"
    Properties:
      LogGroupName: !Sub "${PJPrefix}-vpcflowlogs-group"
      RetentionInDays: !Ref RetentionInDays

# ------------------------------------------------------------#
#  VPCFlowLogs
# ------------------------------------------------------------# 
  VPCFlowLogs:
    Type: "AWS::EC2::FlowLog"
    Properties:
      DeliverLogsPermissionArn: !GetAtt VPCFlowLogsIAMRole.Arn
      LogGroupName: !Ref LogGroup
      ResourceId: { "Fn::ImportValue": !Sub "${PJPrefix}-vpc" }
      ResourceType: "VPC"
      TrafficType: !Ref Filter

# ------------------------------------------------------------#
# Output Parameters
# ------------------------------------------------------------#
Outputs:
#LogGroup
  LogGroupName:
    Value: !Sub "${PJPrefix}-vpcflowlogs-group"
    Export:
      Name: !Sub "${PJPrefix}-vpcflowlogs-group-name"
  LogGroupARN:
    Value: !GetAtt LogGroup.Arn
    Export:
      Name: !Sub "${PJPrefix}-vpcflowlogs-group-arn"

なるほど、監視はmakerelではなく、cloudwatchを使うのね。

UnHealthyHostCount, Latency

UnHealthyHostCount
Number of healthy EC2 instances registered with the load balancer in the specified Availability Zone. Hosts that do not fail the health check beyond the unhealthy threshold are considered healthy. When evaluating this metric, the dimensions should be defined by LoadBalancerName and AvailabilityZone.
This metric represents the number of healthy instances in the specified Availability Zone. Instances may become unhealthy due to connection problems such as non-200 responses (for HTTP and HTTPS health checks) and timeouts when doing health checks. In order to get the total number of all healthy hosts, this metric needs to get each registered AvailabilityZone and add all metrics together.

Latency
The elapsed time from request leaving the load balancer to receiving the corresponding response.

CloudWatch Logs

CloudWatch Logs is a log monitoring service provided by AWS. Collect OS logs and application logs of EC2 instances and monitor them in real time.

Amazon CloudWatch is an application monitoring service that runs on AWS. Can use Amazon CloudWatch to gain visibility into resource utilization, application performance, and operation status across the system. Use these insights to respond and keep your application running smoothly.

With CloudWatch Logs, can mainly used for:
– Log accumulation (you can set the retention period)
– Specific character filtering
– Graph what matched the filter pattern
– Alert settings linked with Amazon SNS(Simple Notification Service)

CloudWatchの取り込みが1GBあたり91.2円、1GBあたりのアーカイブが3.96円。
あれ、これどーやって計算するんだろう。。
たとえば、データ量として大きくなりそうなのはELBだが、ELBでどれ位のボリュームでどれ位のデータ量になるんだろうか??

CloudWatchを使っていこう

まずコンソールにログインします。

ダッシュボードに入ります。

なるほど、確かに魅力あるね。

メトリクスを押下します。

ほほう、インフラエンジニアが好きそうや。

ログも見れますよ、と。なるほどねー

CloudWatch

CloudWatch is a monitoring service for AWS resources and applications running on AWS. You can collect and monitor metrics and log files of various AWS services and set alarms. When you start the corresponding AWS service, data points are regularly sent to CloudWatch, so you can view and analyze the metrics on a graphical screen without being particularly aware. With custom metrics, you can use graphical graphs for metrics collected from your own application. Using the alarm function, not only notification using SNS, addition of EC2 instance by Auto Scaling, or recovery of EC2 instance is also possible.

Data points, metrics
When you start a supported AWS service, data points (monitoring data) are sent to CloudWatch stores data points in metrics.
Metrics can be thought of as monitored variables, and data points can be thought of as the values of variables over time. Data points are not necessarily related to AWS services. It may be the data sent by the script created by the user. In other words, the metric may be the CPU utilization of an EC2 instance, or it may be the response speed of the application or room temperature.
Metrics are identified by name, namespace, and one or more dimensions. Metrics are stored for two weeks.

Name space
Namespaces store metrics. The metric name [CPUUtilization] is used in EC2 and RDS. The namespace [AWS/EC2] or [AWS/RDS] is used as one element to identify metrics.

Dimension
Dimensions are categories of metrics. Statistical monitoring is possible using dimensions. Use the dimension [InstanceId] to check the metrics of an instance. You can use the dimension [AutoScalingGroupName] to monitor data for each autoscaling group.

EC2 Metrics Dimension

AutoScalingGroupName
ImageId
InstanceId
InstanceType

では早速触っていきましょう。