xml文字列を作成し、その文字列をsimplexml_load_string()関数で、オブジェクトに代入。
そのオブジェクトを展開することで、xmlデータを取得できる。
ebay api 2 finding item by keywords
<?php

error_reporting(E_ALL);

$endpoint = 'http://svcs.ebay.com/services/search/FindingService/v1';
$query = 'harry potter';

$filterarray =
	array(
		array(
			'name' => 'MaxPrice',
			'value' => '25',
			'paramName' => 'Currency',
			'paramValue' => 'USD'),
		array(
			'name'=> 'FreeShippingOnly',
			'value'=>'true',
			'paramName'=>'',
			'paramValue'=>''),
		array(
			'name'=>'ListingType',
			'value' => array('AuctionWithBIN','FixedPrice','StoreInventory'),
			'paramName' => '',
			'paramValue' => ''),
	);

function buildXMLFilter ($filterarray){
	global $xmlfilter;

	foreach ($filterarray as $itemfilter){
		$xmlfilter .= "<itemFilter>\n";

		foreach($itemfilter as $key => $value){
			if(is_array($value)){
				foreach($value as $arrayval){
					$xmlfilter .= " <$key>$arrayval</key>\n";
				}
			}
			else {
				if($value != ""){
					$xmlfilter .= " <$key>$value</$key>\n";
				}
			}
		}
		$xmlfilter .= "</itemFilter>\n";
	}
	return "$xmlfilter";
}

buildXMLFilter($filterarray);

$resp = simplexml_load_string(constructPostCallAndGetResponse($endpoint, $query, $xmlfilter));

if ($resp->ack == "Success"){
	$result = '';

	foreach($resp->searchResult->item as $item){
		$pic = $item->gallaryURL;
		$link = $item->viewItemURL;
		$title = $item->title;

		$results .= "<tr><td><img src=\"$pic\"></td><td><a href=\"$link\">$title</a></td></tr>";
	}
} else {
	$results = "<h3>Ops! The request was not successful. Make sure you are using a vlid ";
	$results .= "AppId for the Production environment.</h3>";
}

?>

<html>
<head>
<title>search result for <?php echo $query; ?></title>
<style type="text/css">
body {
	font-family:arial,sans-serif;
}
</style>
</head>
<body>
<h1>ebay search results for <?php echo $query; ?></h1>

<table>
	<tr>
	<td>
		<?php echo $results;?>
	</td>
	</tr>
</table>

</body>
</html>

<?php

function constructPostCallAndGetResponse($endpoint, $query, $xmlfilter){
	global $xmlrequest;

	$xmlrequest  = "<?xml version=\"1.0\" encoding=\"utf-8\"?>\n";
	$xmlrequest .= "<findItemsByKeywordsRequest xmlns=\"http:://www.ebay.com/marketplace/search/v1/services\">\n";
	$xmlrequest .= "<keywords>";
	$xmlrequest .= $query;
	$xmlrequest .= "</keywords>\n";
	$xmlrequest .= $xmlfilter;
	$xmlrequest .= "<paginationInput>\n <entriesPerPage>3</entriesPerPage>\n</paginationInput>\n";
	$xmlrequest .= "</findItemsByKeywordsRequest>";

	$headers = array(
		'X-EBAY-SOA-OPERATION-NAME: findItemsByKeywords',
		'X-EBAY-SOA-SERVICE-VERSION: 1.3.0',
		'X-EBAY-SOA-REQUEST-DATA-FORMAT: XML',
		'X-EBAY-SOA-GLOBAL-ID: EBAY-US',
		'X-EBAY-SOA-SECURITY-APPNAME: ',
		'Content-Type: text/xml;charset=utf-8',
	);

	$session = curl_init($endpoint);
	curl_setopt($session, CURLOPT_POST, true);
	curl_setopt($session, CURLOPT_HTTPHEADER, $headers);
	curl_setopt($session, CURLOPT_POSTFIELDS, $xmlrequest);
	curl_setopt($session, CURLOPT_RETURNTRANSFER, true);

	$responsexml = curl_exec($session);
	curl_close($session);
	return $responsexml;

}

?>
ebay search results for harry potter
Ops! The request was not successful. Make sure you are using a vlid AppId for the Production environment.
上手くいかない。。。
期待値は下記のようなインターフェイス
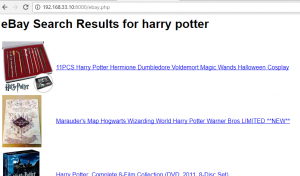
ebay api
サンプルでやっていたら、全く動かなかったので、appidをproductの方で設定したら、あっさり表示。
なんかこのコードはやる気しないな~。
<!DOCTYPE HTML PUBLIC "-//W3C//DTD HTML 4.01 Transitional//EN" "http://www.w3.org/TR/html4/loose.dtd">
<html>
<head>
<meta http-equiv="Content-Type" content="text/html; charset=iso-8859-1">
<title>Merchandising Tutorial Sample</title>
<style type="text/css">body { font-family: arial,sans-serif; font-size: small; } </style>
</head>
<body>
<?php
// Turn on all errors, warnings and notices for easier PHP debugging
error_reporting(E_ALL);
// Define global variables
$s_endpoint = "http://open.api.ebay.com/shopping?"; // Shopping URL to call
$cellColor = "bgcolor=\"#dfefff\""; // Light blue background used for selected items
$m_endpoint = 'http://svcs.ebay.com/MerchandisingService?'; // Merchandising URL to call
$appid = ''; // You will need to supply your own AppID
$responseEncoding = 'XML'; // Type of response we want back
// Create a function for the getMostWatchedItems call
function getMostWatchedItemsResults ($selectedItemID = '', $cellColor = '') {
global $m_endpoint;
global $appid;
global $responseEncoding;
// Construct getMostWatchedItems call with maxResults and categoryId as input
$apicalla = "$m_endpoint";
$apicalla .= "OPERATION-NAME=getMostWatchedItems";
$apicalla .= "&SERVICE-VERSION=1.0.0";
$apicalla .= "&CONSUMER-ID=$appid";
$apicalla .= "&RESPONSE-DATA-FORMAT=$responseEncoding";
$apicalla .= "&maxResults=3";
$apicalla .= "&categoryId=293";
// Load the call and capture the document returned by eBay API
$resp = simplexml_load_file($apicalla);
// Check to see if the response was loaded, else print an error
if ($resp) {
// Set return value for the function to null
$retna = '';
// Verify whether call was successful
if ($resp->ack == "Success") {
// If there were no errors, build the return response for the function
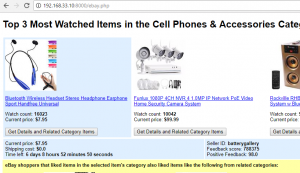
$retna .= "<h1>Top 3 Most Watched Items in the ";
$retna .= $resp->itemRecommendations->item->primaryCategoryName;
$retna .= " Category</h1> \n";
// Build a table for the 3 most watched items
$retna .= "<!-- start table in getMostWatchedItemsResults --> \n";
$retna .= "<table width=\"100%\" cellpadding=\"5\" border=\"0\"><tr> \n";
// For each item node, build a table cell and append it to $retna
foreach($resp->itemRecommendations->item as $item) {
// Set the cell color blue for the selected most watched item
if ($selectedItemID == $item->itemId) {
$thisCellColor = $cellColor;
} else {
$thisCellColor = '';
}
// Determine which price to display
if ($item->currentPrice) {
$price = $item->currentPrice;
} else {
$price = $item->buyItNowPrice;
}
// For each item, create a cell with imageURL, viewItemURL, watchCount, currentPrice
$retna .= "<td $thisCellColor valign=\"bottom\"> \n";
$retna .= "<img src=\"$item->imageURL\"> \n";
$retna .= "<p><a href=\"" . $item->viewItemURL . "\">" . $item->title . "</a></p>\n";
$retna .= 'Watch count: <b>' . $item->watchCount . "</b><br> \n";
$retna .= 'Current price: <b>$' . $price . "</b><br><br> \n";
$retna .= "<FORM ACTION=\"" . $_SERVER['PHP_SELF'] . "\" METHOD=\"POST\"> \n";
$retna .= "<INPUT TYPE=\"hidden\" NAME=\"Selection\" VALUE=\"$item->itemId\"> \n";
$retna .= "<INPUT TYPE=\"submit\" NAME=\"$item->itemId\" ";
$retna .= "VALUE=\"Get Details and Related Category Items\"> \n";
$retna .= "</FORM> \n";
$retna .= "</td> \n";
}
$retna .= "</tr></table> \n<!-- finish table in getMostWatchedItemsResults --> \n";
} else {
// If there were errors, print an error
$retna = "The response contains errors<br>";
$retna .= "Call used was: $apicalla";
} // if errors
} else {
// If there was no response, print an error
$retna = "Dang! Must not have got the getMostWatchedItems response!<br>";
$retna .= "Call used was: $apicalla";
} // End if response exists
// Return the function's value
return $retna;
} // End of getMostWatchedItemsResults function
// Use itemId from selected most watched item as input for a GetSingleItem call
function getSingleItemResults ($selectedItemID) {
global $s_endpoint;
global $appid;
global $responseEncoding;
global $cellColor;
$retnb = '';
// Construct the GetSingleItem call
$apicallb = "$s_endpoint";
$apicallb .= "callname=GetSingleItem";
$apicallb .= "&version=563";
$apicallb .= "&appid=$appid";
$apicallb .= "&itemid=$selectedItemID";
$apicallb .= "&responseencoding=$responseEncoding";
$apicallb .= "&includeselector=Details,ShippingCosts";
// Load the call and capture the document returned by eBay API
$resp = simplexml_load_file($apicallb);
// Check to see if the response was loaded, else print an error
if ($resp) {
// If there is a response check for a picture of the item to display
if ($resp->Item->PictureURL) {
$picURL = $resp->Item->PictureURL;
} else {
$picURL = "http://pics.ebaystatic.com/aw/pics/express/icons/iconPlaceholder_96x96.gif";
}
// Check for shipping cost information
if ($resp->Item->ShippingCostSummary->ShippingServiceCost) {
$shippingCost = "\$" . $resp->Item->ShippingCostSummary->ShippingServiceCost;
} else {
$shippingCost = "Not Specified";
}
// Build a table of item and user details for the selected most watched item
$retnb .= "<!-- start table in getSingleItemResults --> \n";
$retnb .= "<table width=\"100%\" cellpadding=\"5\"><tr> \n";
$retnb .= "<td $cellColor width=\"50%\">\n";
$retnb .= "<div align=\"left\"> <!-- left align item details --> \n";
$retnb .= "Current price: <b>\$" . $resp->Item->ConvertedCurrentPrice . "</b><br> \n";
$retnb .= "Shipping cost: <b>" . $shippingCost . "</b><br>\n";
$retnb .= "Time left: <b>" . getPrettyTimeFromEbayTime($resp->Item->TimeLeft) . "</b><br> \n";
$retnb .= "</div></td> \n";
$retnb .= "<td $cellColor><div align=\"left\"> <!-- left align item details --> \n";
$retnb .= "Seller ID: <b>" . $resp->Item->Seller->UserID . "</b><br> \n";
$retnb .= "Feedback score: <b>" . $resp->Item->Seller->FeedbackScore . "</b><br> \n";
$retnb .= "Positive Feedback: <b>" . $resp->Item->Seller->PositiveFeedbackPercent . "</b><br>\n";
$retnb .= "</div></td></tr></table> \n<!-- finish table in getSingleItemResults --> \n";
} else {
// If there was no response, print an error
$retnb = "Dang! Must not have got the GetSingleItem response!";
} // if $resp
return $retnb;
} // End of getSingleItemResults function
// Use itemId from selected most watched item as input for a getRelatedCategoryItems call
function getRelatedCategoryItemsResults ($selectedItemID) {
global $m_endpoint;
global $appid;
global $responseEncoding;
// Construct the getRelatedCategoryItems call
$apicallc = "$m_endpoint";
$apicallc .= "OPERATION-NAME=getRelatedCategoryItems";
$apicallc .= "&SERVICE-VERSION=1.0.0";
$apicallc .= "&CONSUMER-ID=$appid";
$apicallc .= "&RESPONSE-DATA-FORMAT=$responseEncoding";
$apicallc .= "&maxResults=3";
$apicallc .= "&itemId=$selectedItemID";
// Load the call and capture the document returned by eBay API
$resp = simplexml_load_file($apicallc);
// Check to see if the response was loaded, else print an error
if ($resp) {
$retnc = '';
// Verify whether call was successful
if ($resp->ack == "Success") {
// If there were no errors, build a table for the 3 related category items
$retnc .= "<!-- start table in getRelatedCategoryItemsResults --> \n";
$retnc .= "<table width=\"100%\" cellpadding=\"5\" border=\"0\" bgcolor=\"#FFFFA6\"><tr> \n";
$retnc .= "<td colspan=\"3\"><b>eBay shoppers that liked items in the selected ";
$retnc .= "item's category also liked items like the following from related categories:</b>";
$retnc .= "</td></tr><tr> \n";
// If the response was loaded, parse it and build links
foreach($resp->itemRecommendations->item as $item)
{
// For each item node, build a link and append it to $retnc
$retnc .= "<td valign=\"bottom\"> \n";
$retnc .= "<div align=\"center\"> <!-- center align item details --> \n";
$retnc .= "<img src=\"$item->imageURL\"> \n";
$retnc .= "<p><a href=\"" . $item->viewItemURL . "\">" . $item->title . "</a></p> \n";
$retnc .= "</div></td> \n";
} // foreach
$retnc .= "</tr></table> \n<!-- finish table in getRelatedCategoryItemsResults --> \n";
} else {
// If there were errors, print an error
$retnc = "The response contains errors<br>";
$retnc .= "Call used was: $apicallc";
} // if errors
} else {
// If there was no response, print an error
$retnc = "Dang! Must not have got the getRelatedCategoryItems response! <br> $apicallc";
} // if $resp
return $retnc;
} // End of getRelatedCategoryItemsResults function
// Make returned eBay times pretty
function getPrettyTimeFromEbayTime($eBayTimeString){
// Input is of form 'PT12M25S'
$matchAry = array(); // null out array which will be filled
$pattern = "#P([0-9]{0,3}D)?T([0-9]?[0-9]H)?([0-9]?[0-9]M)?([0-9]?[0-9]S)#msiU";
preg_match($pattern, $eBayTimeString, $matchAry);
$days = (int) $matchAry[1];
$hours = (int) $matchAry[2];
$min = (int) $matchAry[3]; // $matchAry[3] is of form 55M - cast to int
$sec = (int) $matchAry[4];
$retnStr = '';
if ($days) { $retnStr .= " $days day" . pluralS($days); }
if ($hours) { $retnStr .= " $hours hour" . pluralS($hours); }
if ($min) { $retnStr .= " $min minute" . pluralS($min); }
if ($sec) { $retnStr .= " $sec second" . pluralS($sec); }
return $retnStr;
} // function
function pluralS($intIn) {
// if $intIn > 1 return an 's', else return null string
if ($intIn > 1) {
return 's';
} else {
return '';
}
} // function
// Display the response data
// If button clicked for most watched item, display details and related category items
if (isset($_POST['Selection'])) {
$selectedItemID = $_POST['Selection'];
print getMostWatchedItemsResults($selectedItemID, $cellColor);
print getSingleItemResults($selectedItemID);
print getRelatedCategoryItemsResults($selectedItemID);
} else {
// If button not clicked, show only most watched items
print getMostWatchedItemsResults('', '');
}
?>
</body>
</html>
Javascriptの値をphpに渡す
<?php
$s_width = '<script>document.write(screen.width);</script>';
echo $s_width;
無名関数とは?
名前付けされずに定義された関数のこと
<?php

$pension = array(
	"こだわり個人年金"=>'1.186',
	"年金かけはし"=>'1.063',
	"たのしみワンダフル"=>'1.081'
);

print_r(array_map(function($a){$pay = 500;return $a*$pay;}, $pension));
Array ( [こだわり個人年金] => 593 [年金かけはし] => 531.5 [たのしみワンダフル] => 540.5 )
array_filter
配列の値に閾値を設けてフィルタリングする。
<?php

$track = array(
	"みずほFG"=> '2.1',
	"三菱UFJ"=> '3.6',
	"ティアック"=> '0',
	"ランド"=> '0',
	"富士通"=> '-1.0',
	"住友化"=> '22',
	"日産自"=> '2.5',
	"アカツキ" => '1.2'
);

$rate = 1;

$filter_func = function ($value) use ($rate) {
	return ($value >= $rate);
};

$result = array_filter($track, $filter_func);

arsort($result);
var_dump($result);
array(5) { [“住友化”]=> string(2) “22” [“三菱UFJ”]=> string(3) “3.6” [“日産自”]=> string(3) “2.5” [“みずほFG”]=> string(3) “2.1” [“アカツキ”]=> string(3) “1.2” }
$rate = 2の時
array(4) { [“住友化”]=> string(2) “22” [“三菱UFJ”]=> string(3) “3.6” [“日産自”]=> string(3) “2.5” [“みずほFG”]=> string(3) “2.1” }
SORT_NUMERIC, SORT_STRING
並び替えを数値としてするか文字列としてするか支持するためのオプションです。
<?php

$track = array(
	"みずほFG"=> '2.1',
	"三菱UFJ"=> '3.6',
	"ティアック"=> '0',
	"ランド"=> '0',
	"富士通"=> '-1.0',
	"住友化"=> '22',
	"日産自"=> '2.5',
	"アカツキ" => '1.2'
);

arsort($track, SORT_NUMERIC);
var_dump($track);

print "<br>";

ksort($track, SORT_STRING);
var_dump($track);
array(8) { [“住友化”]=> string(2) “22” [“三菱UFJ”]=> string(3) “3.6” [“日産自”]=> string(3) “2.5” [“みずほFG”]=> string(3) “2.1” [“アカツキ”]=> string(3) “1.2” [“ランド”]=> string(1) “0” [“ティアック”]=> string(1) “0” [“富士通”]=> string(4) “-1.0” }
array(8) { [“みずほFG”]=> string(3) “2.1” [“アカツキ”]=> string(3) “1.2” [“ティアック”]=> string(1) “0” [“ランド”]=> string(1) “0” [“三菱UFJ”]=> string(3) “3.6” [“住友化”]=> string(2) “22” [“富士通”]=> string(4) “-1.0” [“日産自”]=> string(3) “2.5” }
array_count_values(); 配列の値(value)の数を数える
配列の値の数を数える
<?php

$array = array(
	"投資家1" => "強く買いたい",
	"投資家2" => "売りたい",
	"投資家3" => "強く買いたい",
	"投資家4" => "買いたい",
	"投資家5" => "様子見",
	"投資家6" => "買いたい",
	"投資家7" => "買いたい",
	"投資家8" => "買いたい"
);

$board = array_count_values($array);
arsort($board);

var_dump($board);
array(4) { [“買いたい”]=> int(4) [“強く買いたい”]=> int(2) [“様子見”]=> int(1) [“売りたい”]=> int(1) }
アナリストレポートの頻出単語を形態素分析で比較
フィーチャーベンチャーキャピタルの2/9と2/6のレポートで、2回以上書かれている単語を見てみます。
http://www.jpx.co.jp/listing/ir-clips/analyst-report/detail/tvdivq0000023hz1-att/ana_re_8462_20180209_1.pdf
http://www.jpx.co.jp/listing/ir-clips/analyst-report/detail/tvdivq0000023hz1-att/ana_up_8462_20180206_2.pdf
<?php
$text = "レポート内容(略)";
$appearances = 2;
$meishiPosIdArr = array(38, 41, 42, 43, 44, 45, 46, 47);
$meishiArr = [];
$mecab = new MeCab_Tagger();
$nodes = $mecab->parseToNode($text);
foreach($nodes as $node){
if($node->getStat() === MECAB_BOS_NODE || $node->getStat() === MECAB_EOS_NODE){
continue;
}
if (in_array($node->getPosId(), $meishiPosIdArr)){
$meishiArr[] = $node->getSurface();
}
}
$retArr = array_count_values($meishiArr);
$retArr = array_filter($retArr, function($v) use($appearances){
return ($v >= $appearances);
});
arsort($retArr, SORT_NUMERIC);
print_r($retArr);
2/9のレポート
Array ( [月] => 10 [Q] => 10 [利益] => 8 [赤字] => 7 [業績] => 5 [経常] => 3 [パラグラフ] => 2 [持分] => 2 [会社] => 2 [株式] => 2 [ファンドレイズ] => 2 [ZMP] => 2 [特] => 2 [子会社] => 2 [利] => 2 [売上] => 2 [幅] => 2 [最終] => 2 [段階] => 2 [ファンド] => 2 [ANEW] => 2 )
2/6のレポート
Array ( [IPO] => 5 [ZMP] => 3 [会社] => 3 [利益] => 3 [株式] => 2 [A] => 2 [ファンド] => 2 [収益] => 2 [M] => 2 [キャピタルゲイン] => 2 [期間] => 2 [黒字] => 2 [株] => 2 [月] => 2 [負] => 2 [経費] => 2 [Q] => 2 [事業] => 2 [状況] => 2 )
頻出単語から推察するに、2/6はIPOが話題に上がっているようですが、2/9は業績に関するレポートに変わっているようですね。
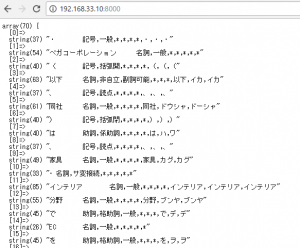
アナリストレポートを形態素分析
では、ベガコーポレーションのレポートを形態素分析してみましょう。ここでは冒頭のみ。
<?php

echo (new MeCab\Tagger())->parse('・ベガコーポレーション(以下、同社)は、家具・インテリア分野でEC を展開
している。自社企画の商品を海外の協力工場で製造し、日本に輸入して
ユーザーに供給するビジネスモデルを有するのが特徴である。また、越
境 EC プラットフォームの運営も手掛けている。');
?>
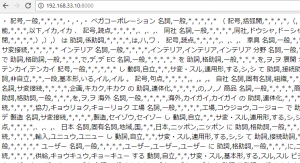
見やすくします。
<?php

$result = explode("\n", rtrim((new MeCab\Tagger())->parse('・ベガコーポレーション(以下、同社)は、家具・インテリア分野でEC を展開
している。自社企画の商品を海外の協力工場で製造し、日本に輸入して
ユーザーに供給するビジネスモデルを有するのが特徴である。また、越
境 EC プラットフォームの運営も手掛けている。')));

print_r('<pre>');
var_dump($result);
print_r('</pre>');