
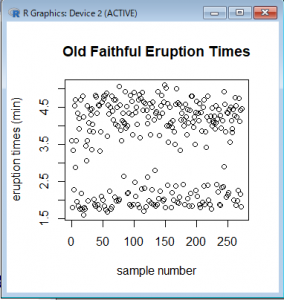
> library(ggplot2)
> names(faithful)
[1] "eruptions" "waiting"
> plot(faithful$eruptions, xlab = "sample number", ylab = "eruption times (min)", main = "Old Faithful Eruption Times")
qplot(x = waiting,
	data = faithful,
	binwindth = 3,
	main = "Waiting time to next eruption(min)")
ggplot(faithful, aes(x = waiting)) +
	geom_histogram(bindwidth = 1)
> names(mtcars)
[1] “mpg” “cyl” “disp” “hp” “drat” “wt” “qsec” “vs” “am” “gear”
[11] “carb”