事象が連続して独立に一定の発生率で起こる過程
-> ランダムなイベントの発生間隔を表す分布
e.g. 地震が起きる間隔、電球の寿命
f(x) = 1/μ e ^-x/μ (x>0)
import numpy as np
import math
import matplotlib.pyplot as plt
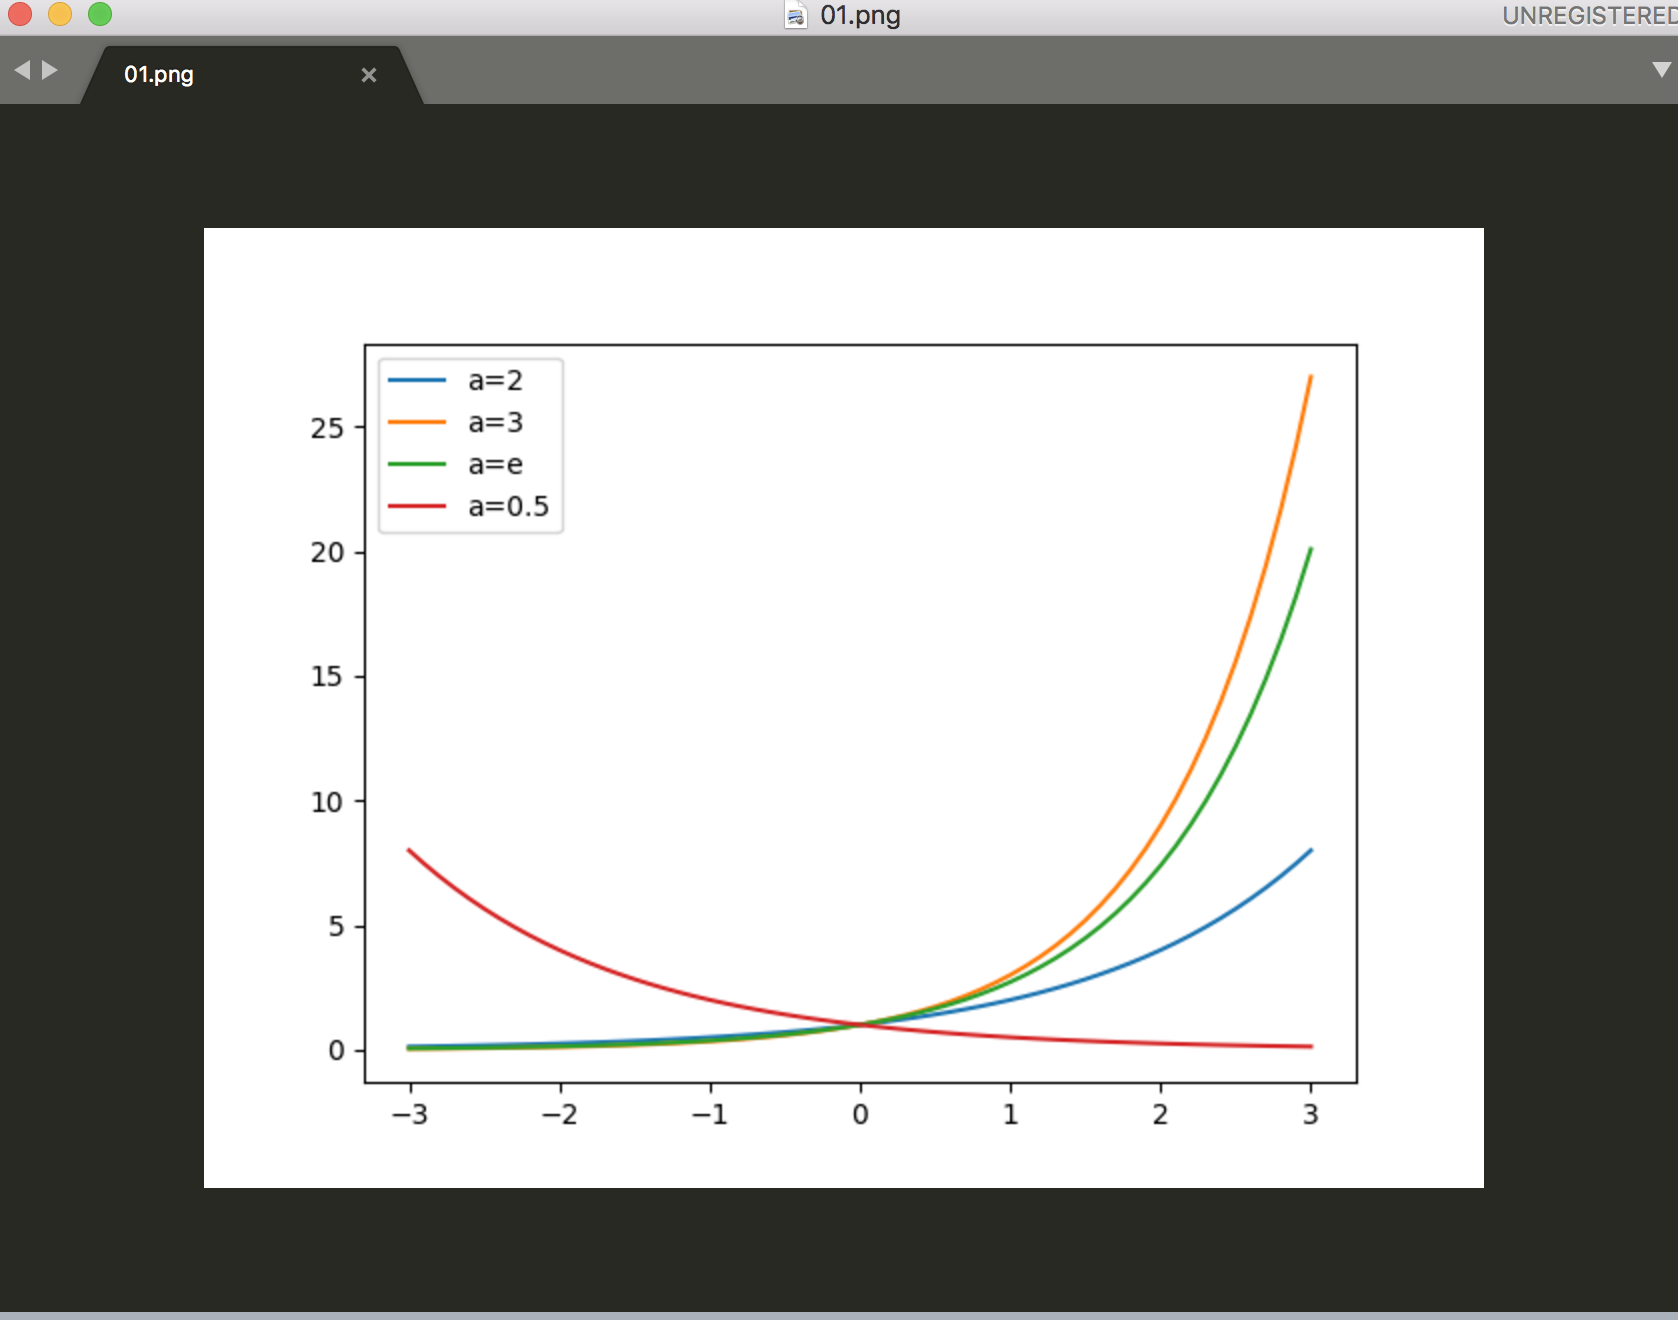
x = np.arange(-3,3.1,0.1)
y_2 = 2**x
y_3 = 3**x
y_e = math.e**x
y_0_5 = 0.5**x
plt.plot(x,y_2,label="a=2")
plt.plot(x,y_3,label="a=3")
plt.plot(x,y_e,label="a=e")
plt.plot(x,y_0_5,label="a=0.5")
plt.legend()
plt.savefig("01")