AWS CloudWatch

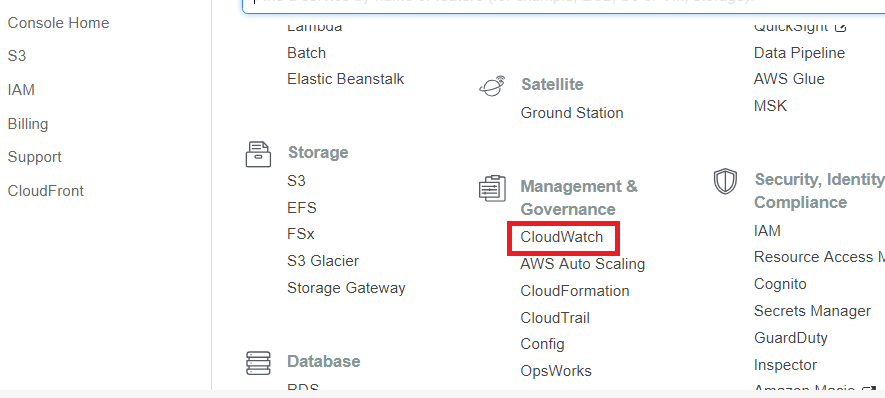
Amazon CloudWatch provides real-time monitoring of Amazon Web Service (AWS) resources and the applications that user are running on AWS. You can use CloudWatch to collect and track metrics. Metrics are variables that can be measured in terms of resources and applications.

The CloudWatch homepage automatically displays metrics about each of the AWS services you are using. In addition, you can create custom dashboards to view custom application metrics or view custom collections of selected metrics.

You can monitor metrics and create alarms that send notifications when thresholds are exceeded or automatically change the resources being monitored. For example, you can monitor CPU usage and disk reads and writes for Amazon EC2 instances, and use that data to decide whether you should launch additional instances to handle the increased load. You can also use this data to save money by shutting down underutilized instances.

What can we do aws monitoring tool “cloud watch”?

What can we do for CloudWatch??

-> CloudWatch is “A fully managed operation monitoring service” provided by AWS, those that monitor various resources of AWS.

In detail and features.
– Can be used without setup
– It detects an abnormal condition and automatically restores it
– Alert notification and action can be set according to metrics.

It can be monitored EC2, EBS, S3, and so on. Cloudwatch have three services.
– CloudWatch : You can make dashboards by graphing multiple items such as CPU and memory.
– CloudWatch Logs:Corresponds to Amazon Linux, RedHat, Windows etc, and by acquiring various logs by putting an agent in the instance. In addtion to OS, application logs are also supported, and you can let alert notice by keyword.
– CloudWatch Events:It is a service that causes some action to be executed by triggering API event.

Other way to watch log is checking access_log, error_log, and monitor_log from Linux.